
- Start >
- Rivers >
- Discharge >
- Inn >
- Langengeisling >
- Chart of year

Chart of year Langengeisling / Sempt
Discharge from 01.01.2024 to 31.12.2024
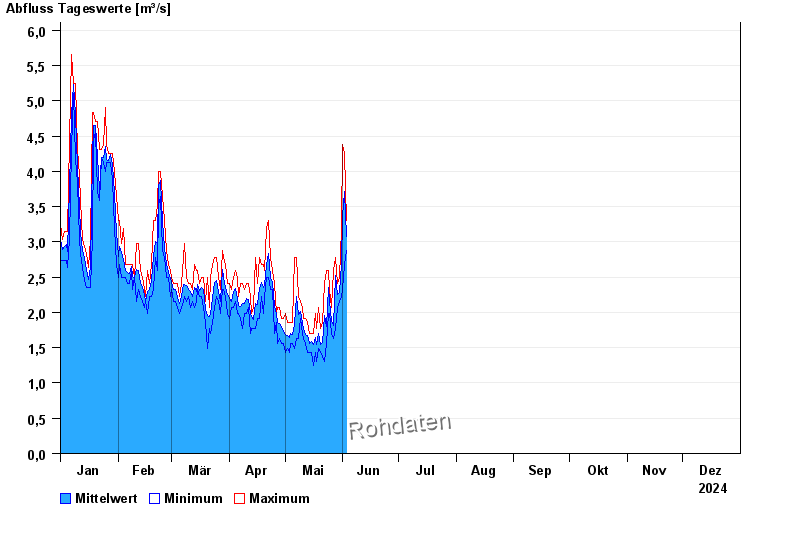
| Date | Mean value [m³/s] | Maximum [m³/s] | Minimum [m³/s] |
|---|---|---|---|
| 07.06.2024 | 2.17 | 2.23 | 1.99 |
| 06.06.2024 | 2.27 | 2.32 | 2.07 |
| 05.06.2024 | 2.28 | 2.41 | 2.15 |
| 04.06.2024 | 2.44 | 2.78 | 2.15 |
| 03.06.2024 | 2.98 | 3.3 | 2.68 |
| 02.06.2024 | 3.72 | 4.25 | 2.68 |
| 01.06.2024 | 3.36 | 4.38 | 2.32 |
© Bayerisches Landesamt für Umwelt 2024