

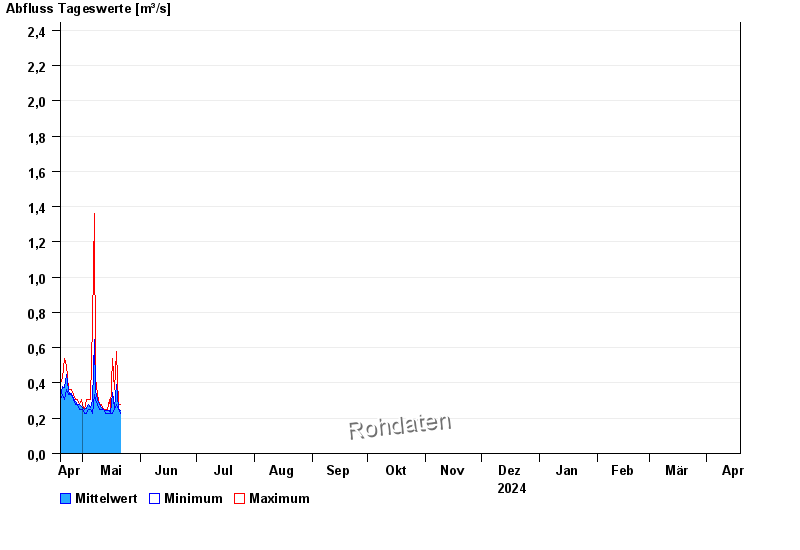
Chart of year Kollbach / Kollbach
Discharge from 19.04.2024 to 18.04.2025
- 10.06.1965 Abfluss: 49 m³/s
- 22.06.1965 Abfluss: 48,1 m³/s
- 01.06.1965 Abfluss: 45,9 m³/s
- 02.06.1995 Abfluss: 45,5 m³/s
- 15.02.1990 Abfluss: 44,4 m³/s
| Date | Mean value [m³/s] | Maximum [m³/s] | Minimum [m³/s] |
|---|---|---|---|
| 22.05.2024 | 0.486 | 0.742 | 0.304 |
| 21.05.2024 | 0.246 | 0.304 | 0.226 |
| 20.05.2024 | 0.254 | 0.277 | 0.251 |
| 19.05.2024 | 0.39 | 0.577 | 0.277 |
| 18.05.2024 | 0.262 | 0.364 | 0.251 |
| 17.05.2024 | 0.346 | 0.538 | 0.226 |
| 16.05.2024 | 0.229 | 0.251 | 0.226 |
© Bayerisches Landesamt für Umwelt 2024