

Chart of total period Kollbach / Kollbach
Discharge from 01.11.1963 to 26.04.2024
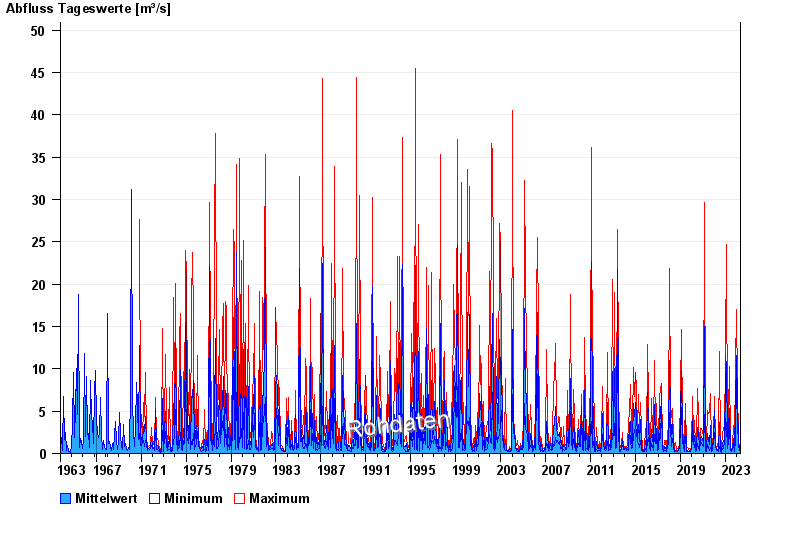
| Date | Mean value [m³/s] | Maximum [m³/s] | Minimum [m³/s] |
|---|---|---|---|
| 26.04.2024 | 0.321 | 0.333 | 0.251 |
| 25.04.2024 | 0.34 | 0.364 | 0.333 |
| 24.04.2024 | 0.335 | 0.364 | 0.333 |
| 23.04.2024 | 0.361 | 0.364 | 0.333 |
| 22.04.2024 | 0.449 | 0.5 | 0.364 |
| 21.04.2024 | 0.377 | 0.538 | 0.304 |
| 20.04.2024 | 0.38 | 0.429 | 0.333 |
© Bayerisches Landesamt für Umwelt 2024