

Chart of year Hochberg / Traun
Discharge from 31.07.2022 to 30.07.2023
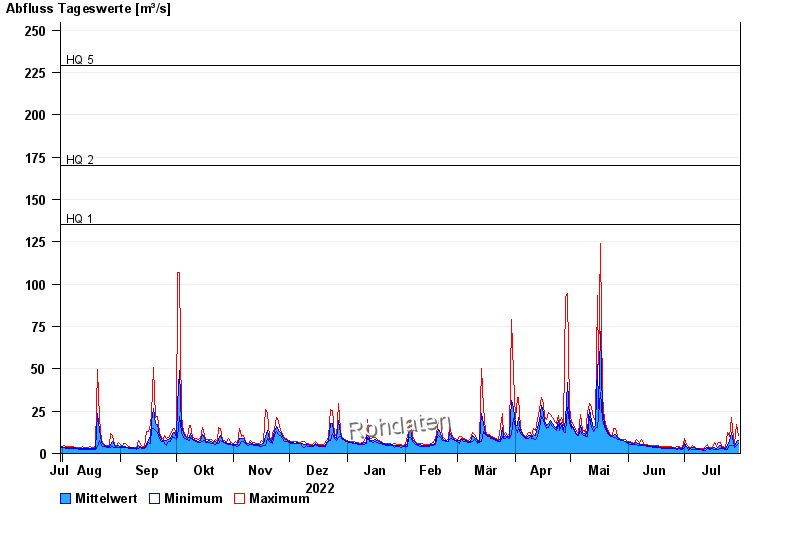
- HQ1 135 m³/s
- HQ2 170 m³/s
- HQ5 229 m³/s
- HQ10 267 m³/s
- HQ20 311 m³/s
- HQ50 360 m³/s
- HQ100 420 m³/s
| Date | Mean value [m³/s] | Maximum [m³/s] | Minimum [m³/s] |
|---|---|---|---|
| 30.07.2023 | 7.96 | 10.6 | 5.62 |
| 29.07.2023 | 7.22 | 17.1 | 4.51 |
| 28.07.2023 | 4.28 | 5.33 | 3.55 |
| 27.07.2023 | 6.23 | 9.02 | 4.51 |
| 26.07.2023 | 12.5 | 21.4 | 4.51 |
| 25.07.2023 | 6.92 | 10.2 | 4.51 |
| 24.07.2023 | 4.43 | 12.3 | 2.38 |
© Bayerisches Landesamt für Umwelt 2024