

Chart of year Hochberg / Traun
Discharge from 01.01.2021 to 31.12.2021
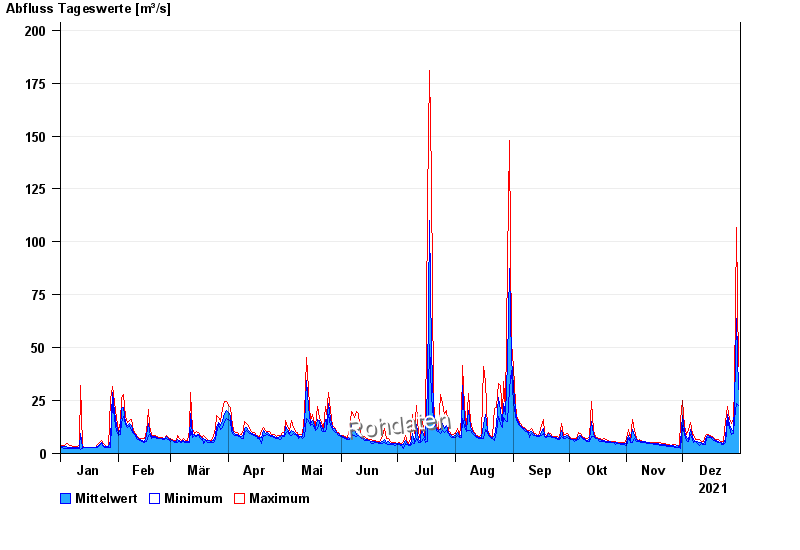
| Date | Mean value [m³/s] | Maximum [m³/s] | Minimum [m³/s] |
|---|---|---|---|
| 31.12.2021 | 30.4 | 41.3 | 22.9 |
| 30.12.2021 | 63.8 | 107 | 23.4 |
| 29.12.2021 | 23.5 | 32.4 | 16.1 |
| 28.12.2021 | 10.8 | 16.1 | 9.55 |
| 27.12.2021 | 11.5 | 14.3 | 9.18 |
| 26.12.2021 | 13.7 | 16.1 | 12.5 |
| 25.12.2021 | 18.2 | 22.3 | 15.7 |
© Bayerisches Landesamt für Umwelt 2024