

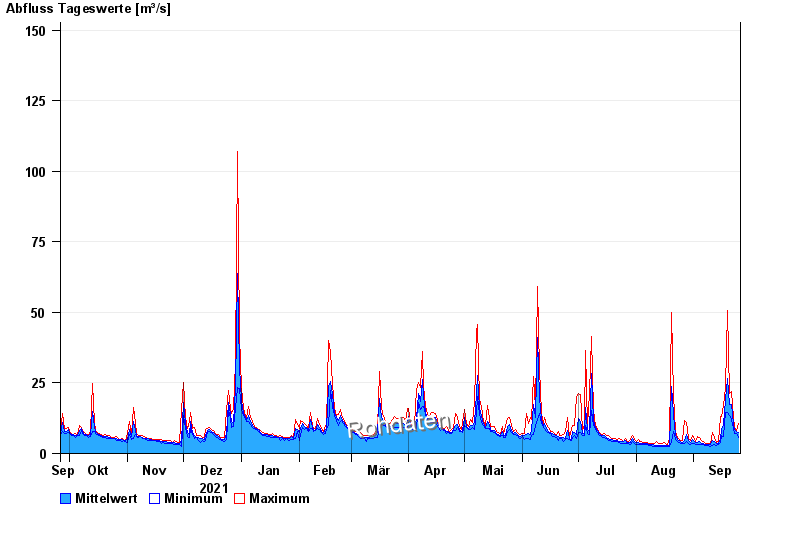
Chart of year Hochberg / Traun
Discharge from 26.09.2021 to 25.09.2022
- 12.08.2002 Abfluss: 409 m³/s
- 02.06.2013 Abfluss: 347 m³/s
- 26.06.1995 Abfluss: 308 m³/s
- 03.06.2010 Abfluss: 302 m³/s
- 20.07.1981 Abfluss: 302 m³/s
| Date | Mean value [m³/s] | Maximum [m³/s] | Minimum [m³/s] |
|---|---|---|---|
| 25.09.2022 | 7.43 | 10.5 | 5.8 |
| 24.09.2022 | 7.68 | 8.16 | 7.09 |
| 23.09.2022 | 8.49 | 9.27 | 7.09 |
| 22.09.2022 | 10.4 | 12.6 | 8.91 |
| 21.09.2022 | 17.4 | 21.8 | 12.2 |
| 20.09.2022 | 17.5 | 21.2 | 13.5 |
| 19.09.2022 | 26.5 | 50.6 | 14.5 |
© Bayerisches Landesamt für Umwelt 2024