

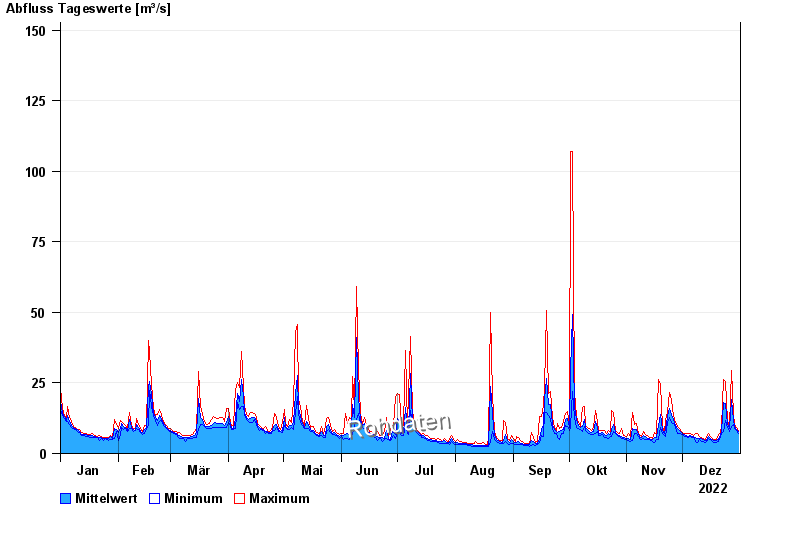
Chart of year Hochberg / Traun
Discharge from 01.01.2022 to 31.12.2022
- 12.08.2002 Abfluss: 409 m³/s
- 02.06.2013 Abfluss: 347 m³/s
- 26.06.1995 Abfluss: 308 m³/s
- 03.06.2010 Abfluss: 302 m³/s
- 20.07.1981 Abfluss: 302 m³/s
| Date | Mean value [m³/s] | Maximum [m³/s] | Minimum [m³/s] |
|---|---|---|---|
| 31.12.2022 | 7.93 | 8.31 | 7.26 |
| 30.12.2022 | 8.64 | 9.09 | 8.31 |
| 29.12.2022 | 9.57 | 10.3 | 8.73 |
| 28.12.2022 | 11.8 | 14.3 | 10.3 |
| 27.12.2022 | 19.2 | 29.3 | 9.51 |
| 26.12.2022 | 8.77 | 9.51 | 7.97 |
| 25.12.2022 | 10.2 | 11.6 | 9.09 |
© Bayerisches Landesamt für Umwelt 2024