

Chart of year Hochberg / Traun
Discharge from 17.11.2022 to 16.11.2023
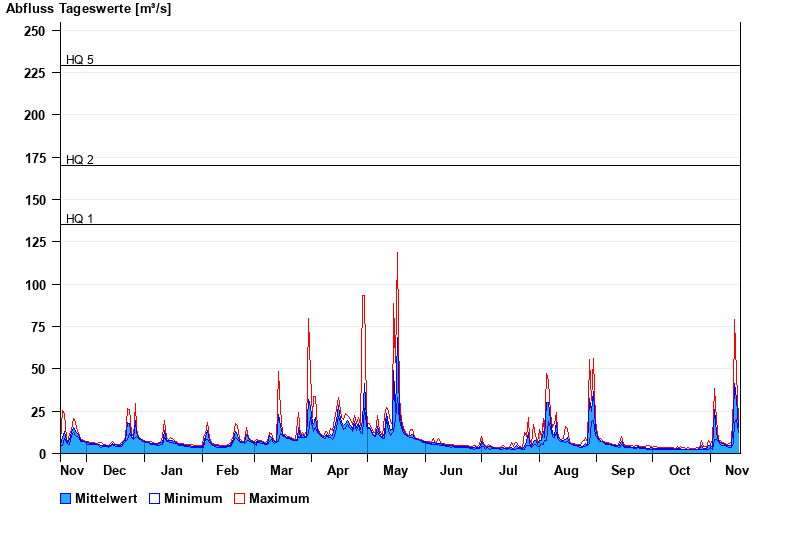
- HQ1 135 m³/s
- HQ2 170 m³/s
- HQ5 229 m³/s
- HQ10 267 m³/s
- HQ20 311 m³/s
- HQ50 360 m³/s
- HQ100 420 m³/s
| Date | Mean value [m³/s] | Maximum [m³/s] | Minimum [m³/s] |
|---|---|---|---|
| 16.11.2023 | 15.4 | 20.3 | 12.4 |
| 15.11.2023 | 32.3 | 47 | 20.3 |
| 14.11.2023 | 41.3 | 79.4 | 18.2 |
| 13.11.2023 | 22.6 | 32.5 | 6.25 |
| 12.11.2023 | 4.69 | 6.9 | 3.77 |
| 11.11.2023 | 4.77 | 5.91 | 3.77 |
| 10.11.2023 | 4.97 | 5.61 | 3.99 |
© Bayerisches Landesamt für Umwelt 2025