

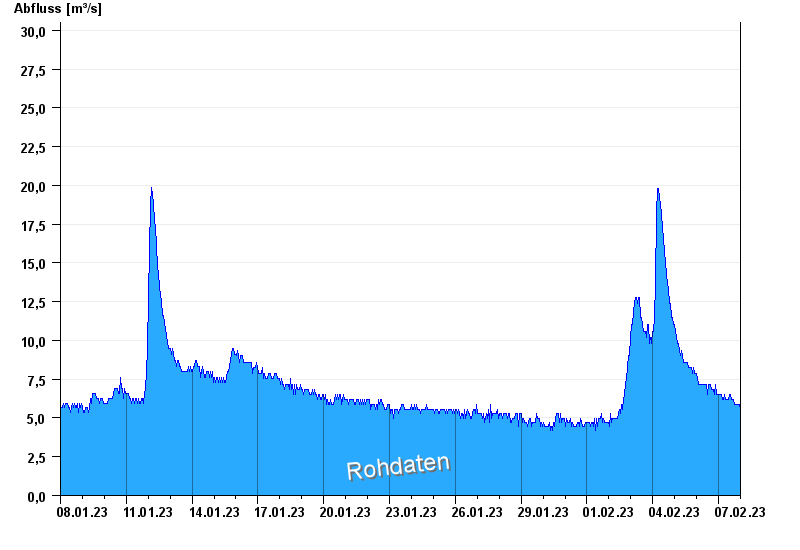
Chart of month Hochberg / Traun
Discharge from 08.01.2023 to 07.02.2023
- 12.08.2002 Abfluss: 409 m³/s
- 02.06.2013 Abfluss: 347 m³/s
- 26.06.1995 Abfluss: 308 m³/s
- 03.06.2010 Abfluss: 302 m³/s
- 20.07.1981 Abfluss: 302 m³/s
| Date | Runoff [m³/s] |
|---|---|
| 07.02.2023 23:45 | 5.56 |
| 07.02.2023 23:30 | 5.27 |
| 07.02.2023 23:15 | 5.27 |
| 07.02.2023 23:00 | 5.56 |
| 07.02.2023 22:45 | 5.87 |
| 07.02.2023 22:30 | 5.87 |
| 07.02.2023 22:15 | 5.56 |
© Bayerisches Landesamt für Umwelt 2024