

Chart of total period Hammer / Oberteisendorfer Ache
Discharge from 01.11.1964 to 01.05.2024
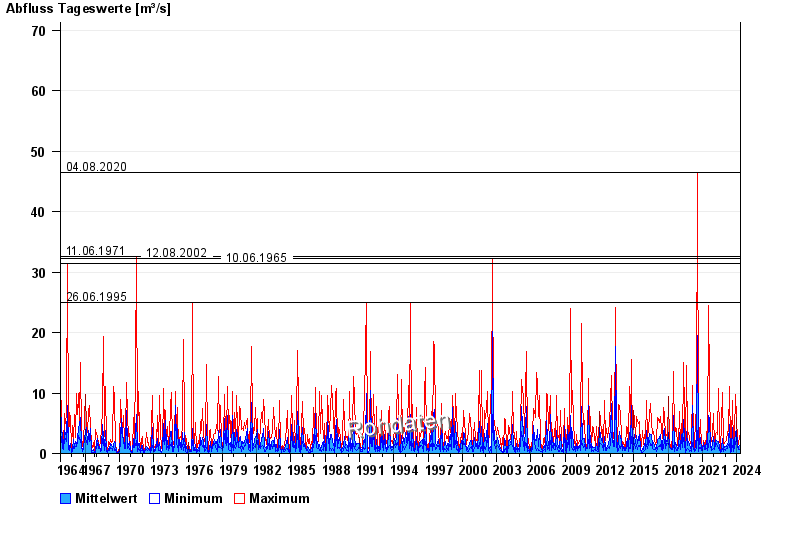
- 04.08.2020 Abfluss: 46,5 m³/s
- 11.06.1971 Abfluss: 32,5 m³/s
- 12.08.2002 Abfluss: 32,2 m³/s
- 10.06.1965 Abfluss: 31,4 m³/s
- 26.06.1995 Abfluss: 25 m³/s
| Date | Mean value [m³/s] | Maximum [m³/s] | Minimum [m³/s] |
|---|---|---|---|
| 01.05.2024 | 0.479 | 0.503 | 0.389 |
| 30.04.2024 | 0.559 | 0.622 | 0.503 |
| 29.04.2024 | 0.714 | 0.887 | 0.622 |
| 28.04.2024 | 0.815 | 1.03 | 0.75 |
| 27.04.2024 | 0.703 | 0.887 | 0.622 |
| 26.04.2024 | 0.538 | 0.622 | 0.503 |
| 25.04.2024 | 0.595 | 0.622 | 0.503 |
© Bayerisches Landesamt für Umwelt 2024