
- Start >
- Rivers >
- Discharge >
- Inn >
- Großschwindau >
- Chart of year

Chart of year Großschwindau / Goldach
Discharge from 24.09.2020 to 23.09.2021
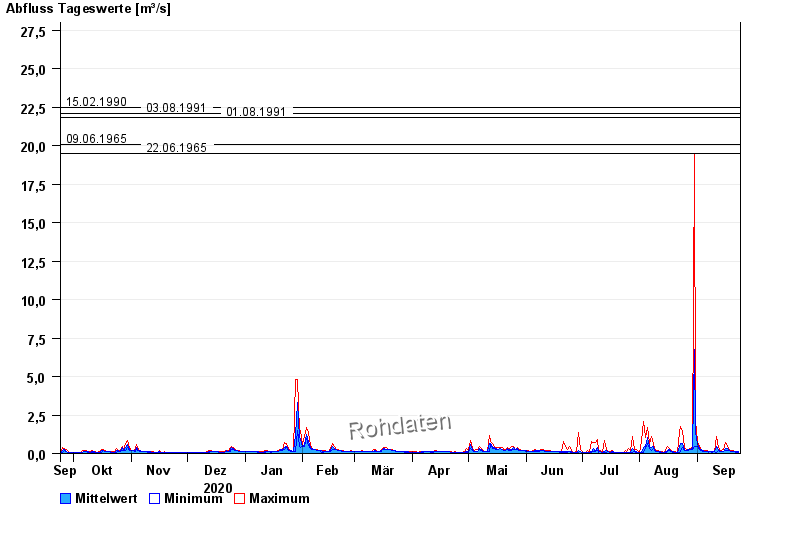
- 15.02.1990 Abfluss: 22,5 m³/s
- 03.08.1991 Abfluss: 22,1 m³/s
- 01.08.1991 Abfluss: 21,8 m³/s
- 09.06.1965 Abfluss: 20,1 m³/s
- 22.06.1965 Abfluss: 19,5 m³/s
| Date | Mean value [m³/s] | Maximum [m³/s] | Minimum [m³/s] |
|---|---|---|---|
| 23.09.2021 | 0.107 | 0.107 | 0.083 |
| 22.09.2021 | 0.107 | 0.107 | 0.083 |
| 21.09.2021 | 0.11 | 0.135 | 0.107 |
| 20.09.2021 | 0.136 | 0.166 | 0.107 |
| 19.09.2021 | 0.153 | 0.166 | 0.135 |
| 18.09.2021 | 0.188 | 0.2 | 0.166 |
| 17.09.2021 | 0.31 | 0.523 | 0.2 |
© Bayerisches Landesamt für Umwelt 2024