
- Start >
- Rivers >
- Discharge >
- Inn >
- Großschwindau >
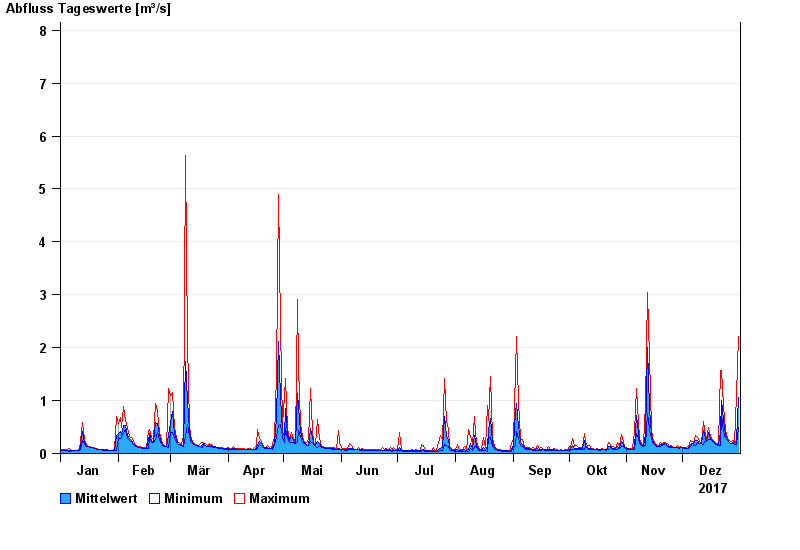
- Chart of year

Chart of year Großschwindau / Goldach
Discharge from 01.01.2017 to 31.12.2017
- 15.02.1990 Abfluss: 22,5 m³/s
- 03.08.1991 Abfluss: 22,1 m³/s
- 01.08.1991 Abfluss: 21,8 m³/s
- 09.06.1965 Abfluss: 20,1 m³/s
- 22.06.1965 Abfluss: 19,5 m³/s
| Date | Mean value [m³/s] | Maximum [m³/s] | Minimum [m³/s] |
|---|---|---|---|
| 31.12.2017 | 1.05 | 2.21 | 0.495 |
| 30.12.2017 | 0.265 | 1.12 | 0.165 |
| 29.12.2017 | 0.179 | 0.182 | 0.165 |
| 28.12.2017 | 0.207 | 0.237 | 0.182 |
| 27.12.2017 | 0.196 | 0.218 | 0.182 |
| 26.12.2017 | 0.215 | 0.237 | 0.2 |
| 25.12.2017 | 0.26 | 0.277 | 0.237 |
© Bayerisches Landesamt für Umwelt 2024