

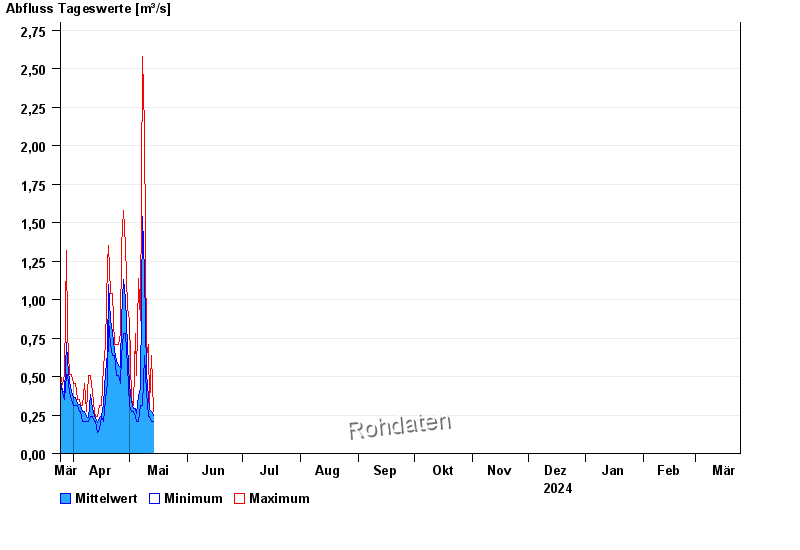
Chart of year Gaißach / Große Gaißach
Discharge from 25.03.2024 to 24.03.2025
| Date | Mean value [m³/s] | Maximum [m³/s] | Minimum [m³/s] |
|---|---|---|---|
| 05.06.2024 | 2.2 | 2.74 | 1.71 |
| 04.06.2024 | 6.2 | 18.2 | 2.74 |
| 03.06.2024 | 16.4 | 57.2 | 1.46 |
| 02.06.2024 | 2.6 | 4.38 | 1.58 |
| 01.06.2024 | 10.5 | 17.4 | 2.12 |
| 31.05.2024 | 2.52 | 3.8 | 0.948 |
| 30.05.2024 | 0.895 | 1.35 | 0.507 |
© Bayerisches Landesamt für Umwelt 2024