

Chart of year Gaißach / Große Gaißach
Discharge from 07.05.2021 to 06.05.2022
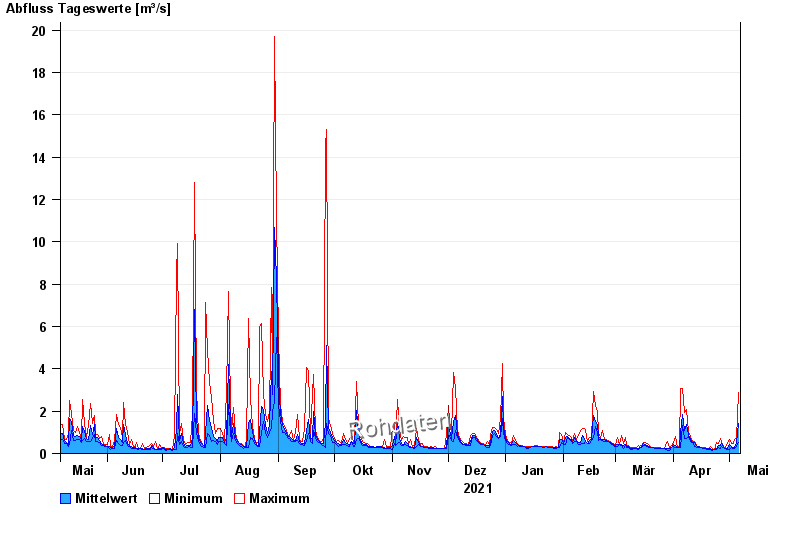
| Date | Mean value [m³/s] | Maximum [m³/s] | Minimum [m³/s] |
|---|---|---|---|
| 06.05.2022 | 1.42 | 2.88 | 0.516 |
| 05.05.2022 | 0.468 | 0.721 | 0.353 |
| 04.05.2022 | 0.306 | 0.648 | 0.234 |
| 03.05.2022 | 0.297 | 0.458 | 0.234 |
| 02.05.2022 | 0.336 | 0.458 | 0.268 |
| 01.05.2022 | 0.423 | 0.648 | 0.205 |
| 30.04.2022 | 0.241 | 0.516 | 0.205 |
© Bayerisches Landesamt für Umwelt 2024