
- Start >
- Rivers >
- Discharge >
- Inn >
- Fritz am Sand >
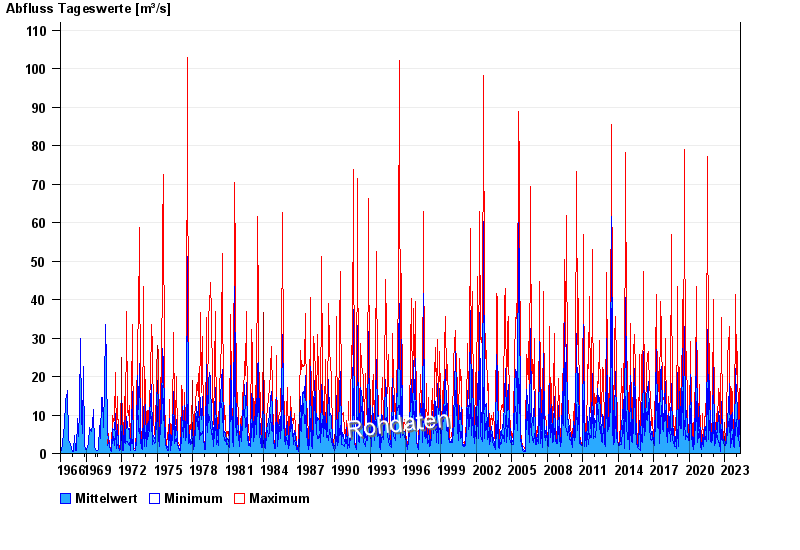
- Chart of total period

Chart of total period Fritz am Sand / Weiße Traun
Discharge from 01.11.1966 to 26.04.2024
| Date | Mean value [m³/s] | Maximum [m³/s] | Minimum [m³/s] |
|---|---|---|---|
| 26.04.2024 | 0.511 | 0.511 | 0.511 |
| 25.04.2024 | 0.51 | 0.591 | 0.378 |
| 24.04.2024 | 0.511 | 0.591 | 0.378 |
| 23.04.2024 | 0.511 | 0.511 | 0.511 |
| 22.04.2024 | 0.535 | 0.591 | 0.441 |
| 21.04.2024 | 0.588 | 0.591 | 0.511 |
| 20.04.2024 | 0.715 | 1.01 | 0.511 |
© Bayerisches Landesamt für Umwelt 2024