

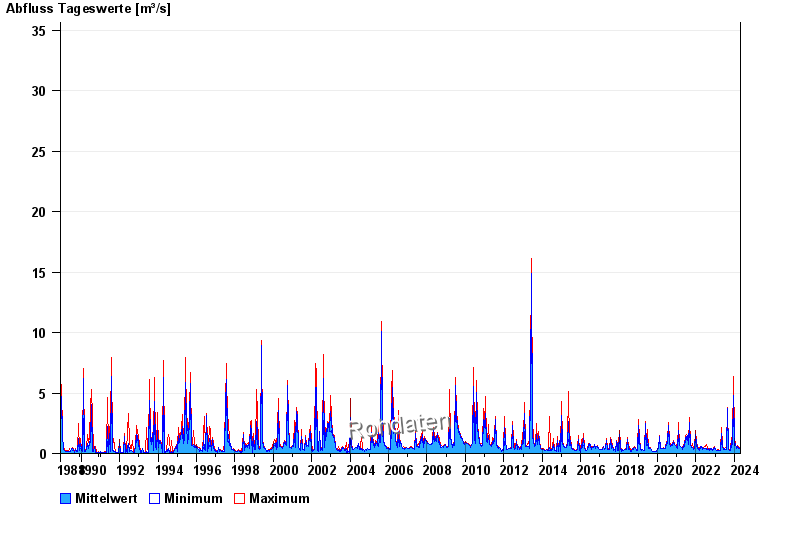
Chart of total period Freising / Schleifermoosach
Discharge from 30.11.1988 to 28.04.2024
 Für diesen Pegel sind keine Jährlichkeiten hinterlegt.
| Date | Mean value [m³/s] | Maximum [m³/s] | Minimum [m³/s] |
|---|---|---|---|
| 28.04.2024 | 0.373 | 0.392 | 0.36 |
| 27.04.2024 | 0.374 | 0.392 | 0.36 |
| 26.04.2024 | 0.38 | 0.392 | 0.36 |
| 25.04.2024 | 0.377 | 0.392 | 0.36 |
| 24.04.2024 | 0.384 | 0.392 | 0.36 |
| 23.04.2024 | 0.396 | 0.424 | 0.392 |
| 22.04.2024 | 0.424 | 0.424 | 0.424 |
© Bayerisches Landesamt für Umwelt 2024