
- Start >
- Rivers >
- Discharge >
- Inn >
- Feldolling >
- Chart of year

Chart of year Feldolling / Mangfall
Discharge from 26.06.2018 to 25.06.2019
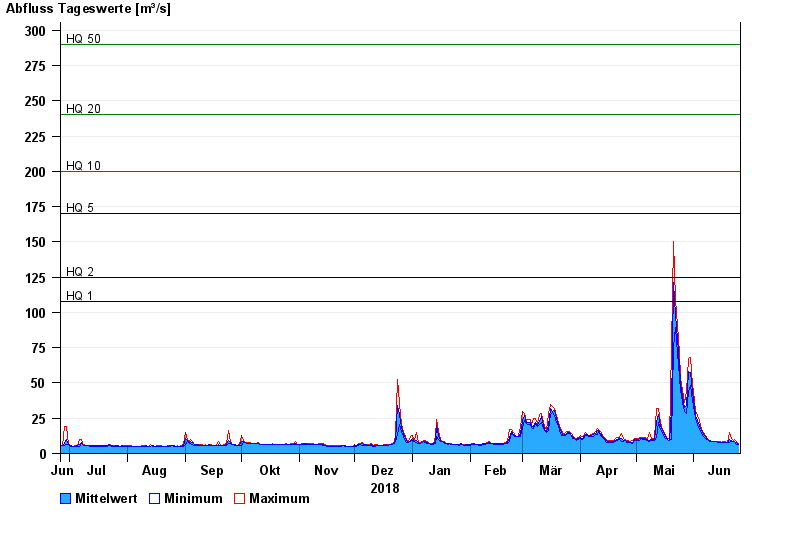
- HQ1 108 m³/s
- HQ2 125 m³/s
- HQ5 170 m³/s
- HQ10 200 m³/s
- HQ20 240 m³/s
- HQ50 290 m³/s
- HQ100 340 m³/s
| Date | Mean value [m³/s] | Maximum [m³/s] | Minimum [m³/s] |
|---|---|---|---|
| 25.06.2019 | 6.49 | 7.06 | 6.29 |
| 24.06.2019 | 7.76 | 8.8 | 6.29 |
| 23.06.2019 | 8.63 | 9.75 | 8.34 |
| 22.06.2019 | 8.71 | 9.27 | 8.34 |
| 21.06.2019 | 8.96 | 10.8 | 8.33 |
| 20.06.2019 | 9.6 | 14.7 | 7.89 |
| 19.06.2019 | 7.89 | 7.89 | 7.89 |
© Bayerisches Landesamt für Umwelt 2024