
- Start >
- Rivers >
- Discharge >
- Inn >
- Feldolling >
- Chart of year

Chart of year Feldolling / Mangfall
Discharge from 08.12.2019 to 07.12.2020
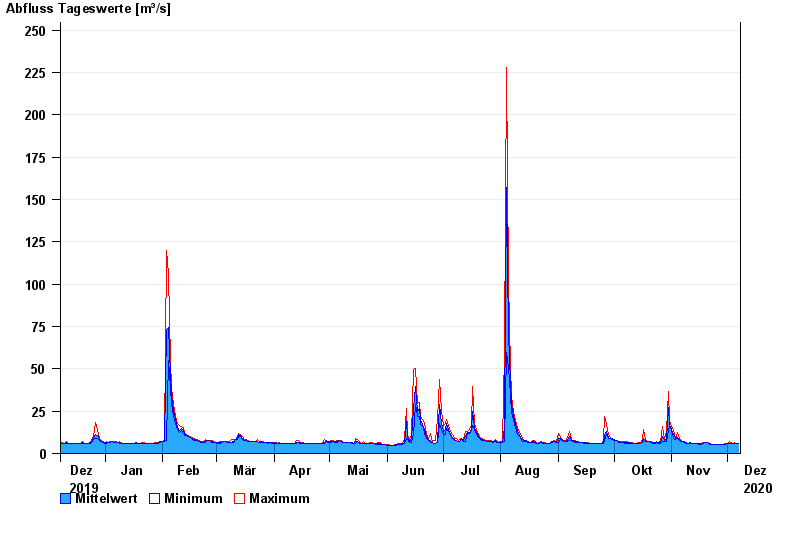
| Date | Mean value [m³/s] | Maximum [m³/s] | Minimum [m³/s] |
|---|---|---|---|
| 07.12.2020 | 5.9 | 5.91 | 5.9 |
| 06.12.2020 | 5.9 | 5.9 | 5.9 |
| 05.12.2020 | 5.91 | 6.26 | 5.9 |
| 04.12.2020 | 5.9 | 5.9 | 5.9 |
| 03.12.2020 | 5.9 | 6.25 | 5.89 |
| 02.12.2020 | 5.99 | 7.01 | 5.89 |
| 01.12.2020 | 5.89 | 5.89 | 5.89 |
© Bayerisches Landesamt für Umwelt 2024