
- Start >
- Rivers >
- Discharge >
- Inn >
- Feldolling >
- Chart of year

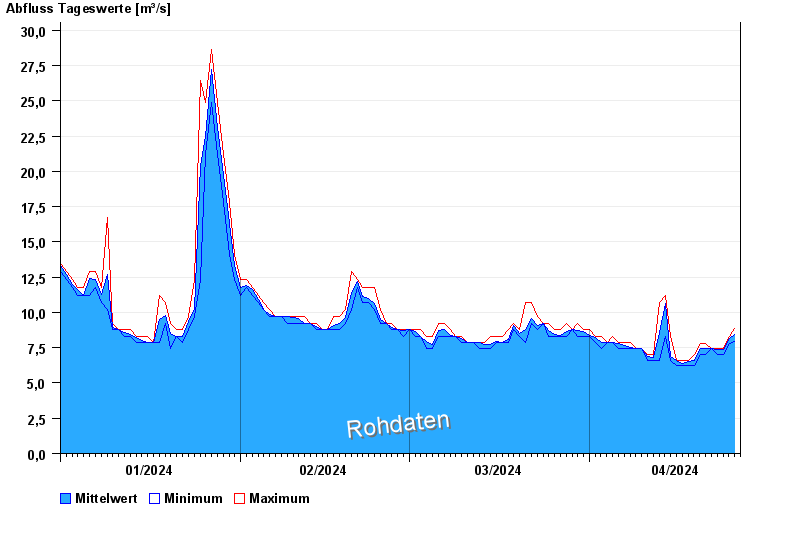
Chart of year Feldolling / Mangfall
Discharge from 01.01.2024 to 26.04.2024
| Date | Mean value [m³/s] | Maximum [m³/s] | Minimum [m³/s] |
|---|---|---|---|
| 26.04.2024 | 7.01 | 7.01 | 7.01 |
| 25.04.2024 | 7.35 | 7.42 | 7.01 |
| 24.04.2024 | 7.36 | 7.42 | 7.01 |
| 23.04.2024 | 7.39 | 7.42 | 7.01 |
| 22.04.2024 | 7.42 | 7.42 | 7.42 |
| 21.04.2024 | 7.45 | 7.83 | 7.01 |
| 20.04.2024 | 7.45 | 7.83 | 7.01 |
© Bayerisches Landesamt für Umwelt 2024