
- Start >
- Rivers >
- Discharge >
- Inn >
- Feldolling >
- Chart of year

Chart of year Feldolling / Mangfall
Discharge from 23.07.2019 to 22.07.2020
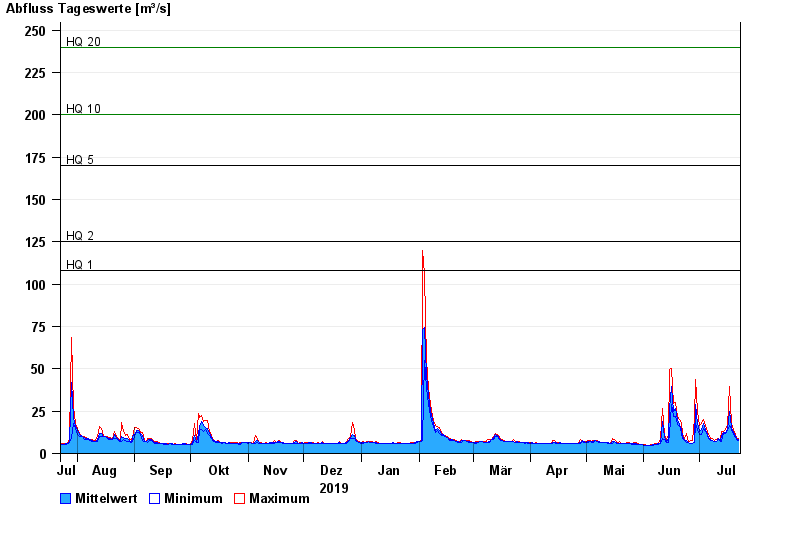
- HQ1 108 m³/s
- HQ2 125 m³/s
- HQ5 170 m³/s
- HQ10 200 m³/s
- HQ20 240 m³/s
- HQ50 290 m³/s
- HQ100 340 m³/s
| Date | Mean value [m³/s] | Maximum [m³/s] | Minimum [m³/s] |
|---|---|---|---|
| 22.07.2020 | 8.25 | 8.76 | 7.86 |
| 21.07.2020 | 8.66 | 9.23 | 8.3 |
| 20.07.2020 | 10 | 11.2 | 9.23 |
| 19.07.2020 | 12.5 | 14.1 | 11.2 |
| 18.07.2020 | 15.5 | 17.8 | 14.1 |
| 17.07.2020 | 24.9 | 39.3 | 16.5 |
| 16.07.2020 | 14 | 16.5 | 13.5 |
© Bayerisches Landesamt für Umwelt 2024