
- Start >
- Rivers >
- Discharge >
- Inn >
- Feldolling >
- Chart of month

Chart of month Feldolling / Mangfall
Discharge from 28.01.2020 to 27.02.2020
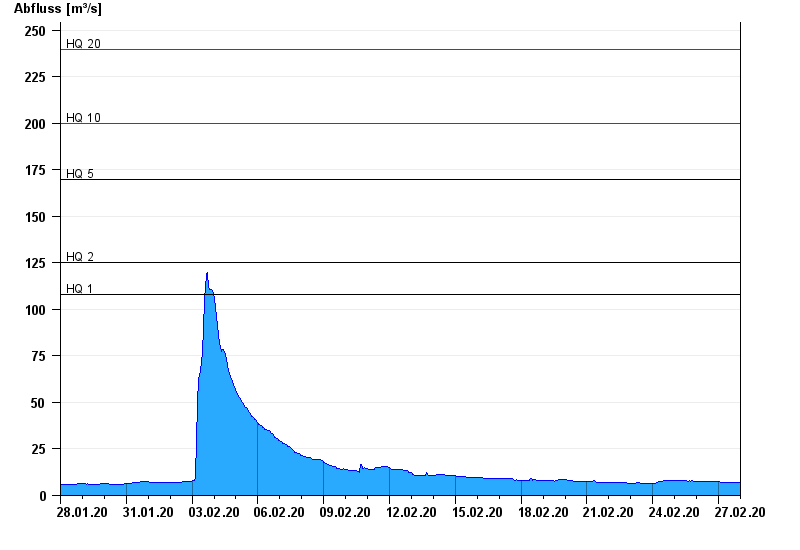
- HQ1 108 m³/s
- HQ2 125 m³/s
- HQ5 170 m³/s
- HQ10 200 m³/s
- HQ20 240 m³/s
- HQ50 290 m³/s
- HQ100 340 m³/s
| Date | Runoff [m³/s] |
|---|---|
| 27.02.2020 23:45 | 6.98 |
| 27.02.2020 23:30 | 6.98 |
| 27.02.2020 23:15 | 6.98 |
| 27.02.2020 23:00 | 6.98 |
| 27.02.2020 22:45 | 6.98 |
| 27.02.2020 22:30 | 6.98 |
| 27.02.2020 22:15 | 6.98 |
© Bayerisches Landesamt für Umwelt 2024