

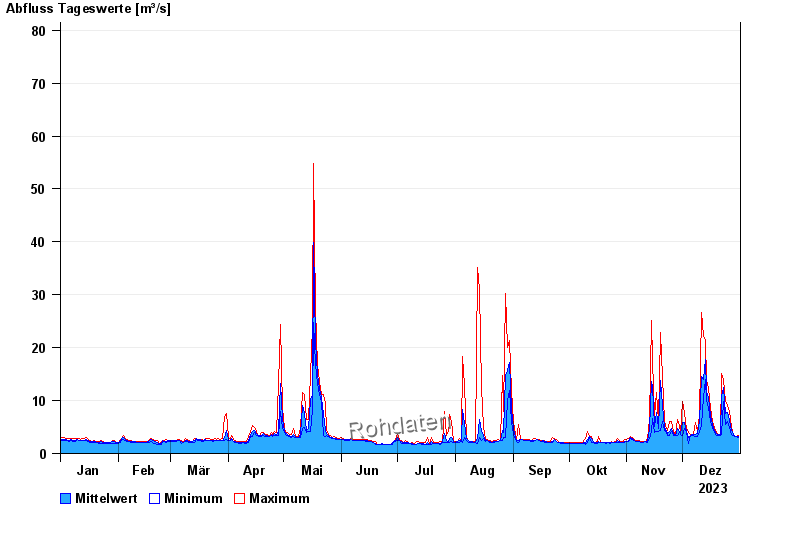
Chart of year Erb / Leitzach
Discharge from 01.01.2023 to 31.12.2023
- 02.06.2013 Abfluss: 143 m³/s
- 31.05.1940 Abfluss: 130 m³/s
- 04.08.2020 Abfluss: 118 m³/s
- 03.06.2010 Abfluss: 107 m³/s
- 09.07.1954 Abfluss: 105 m³/s
| Date | Mean value [m³/s] | Maximum [m³/s] | Minimum [m³/s] |
|---|---|---|---|
| 31.12.2023 | 3.2 | 3.43 | 2.99 |
| 30.12.2023 | 3.2 | 3.2 | 3.2 |
| 29.12.2023 | 3.39 | 3.43 | 3.2 |
| 28.12.2023 | 3.58 | 3.66 | 3.43 |
| 27.12.2023 | 4.27 | 4.92 | 3.66 |
| 26.12.2023 | 6.21 | 7.96 | 4.92 |
| 25.12.2023 | 7.66 | 8.98 | 6.06 |
© Bayerisches Landesamt für Umwelt 2024