

Chart of year Engfurt / Isen
Discharge from 30.06.2022 to 29.06.2023
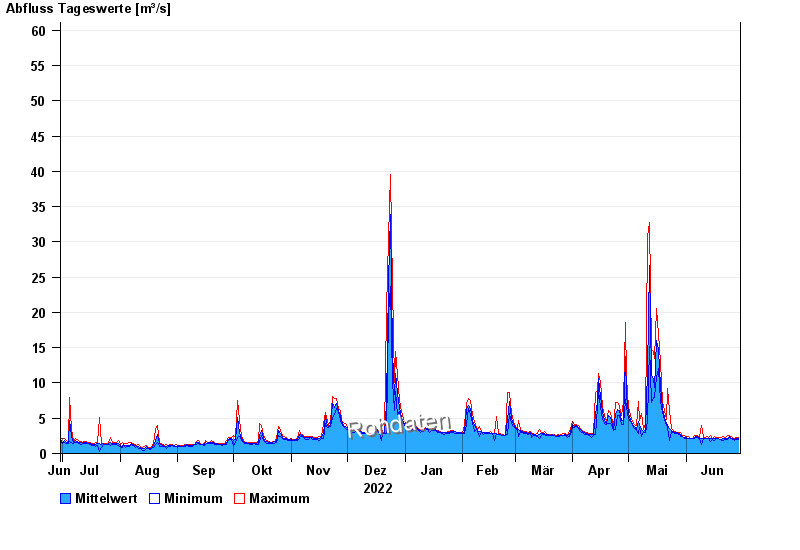
note
zeitweise Beeinflussung durch Kraftwerksbetrieb möglich
- 09.07.1954 Abfluss: 265 m³/s
- 02.02.1985 Abfluss: 173 m³/s
- 31.01.1982 Abfluss: 141 m³/s
- 16.01.1968 Abfluss: 138 m³/s
- 03.08.1991 Abfluss: 136 m³/s
| Date | Mean value [m³/s] | Maximum [m³/s] | Minimum [m³/s] |
|---|---|---|---|
| 29.06.2023 | 2.13 | 2.26 | 1.97 |
| 28.06.2023 | 2.08 | 2.26 | 1.97 |
| 27.06.2023 | 2 | 2.06 | 1.87 |
| 26.06.2023 | 2.11 | 2.16 | 1.97 |
| 25.06.2023 | 2.16 | 2.37 | 2.06 |
| 24.06.2023 | 2.41 | 2.6 | 2.26 |
| 23.06.2023 | 2.17 | 2.49 | 1.97 |
© Bayerisches Landesamt für Umwelt 2024