

Chart of month Engfurt / Isen
Discharge from 01.03.2020 to 31.03.2020
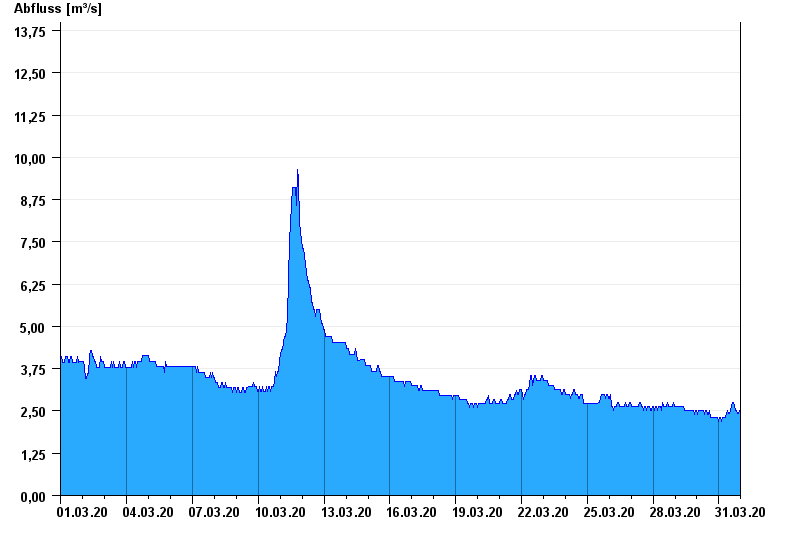
note
zeitweise Beeinflussung durch Kraftwerksbetrieb möglich
- 09.07.1954 Abfluss: 265 m³/s
- 02.02.1985 Abfluss: 173 m³/s
- 31.01.1982 Abfluss: 141 m³/s
- 16.01.1968 Abfluss: 138 m³/s
- 03.08.1991 Abfluss: 136 m³/s
| Date | Runoff [m³/s] |
|---|---|
| 01.04.2020 00:45 | 2.41 |
| 01.04.2020 00:30 | 2.52 |
| 01.04.2020 00:15 | 2.52 |
| 01.04.2020 00:00 | 2.52 |
| 31.03.2020 23:45 | 2.52 |
| 31.03.2020 23:30 | 2.52 |
| 31.03.2020 23:15 | 2.52 |
© Bayerisches Landesamt für Umwelt 2024