
- Start >
- Rivers >
- Discharge >
- Inn >
- Eggenfelden >
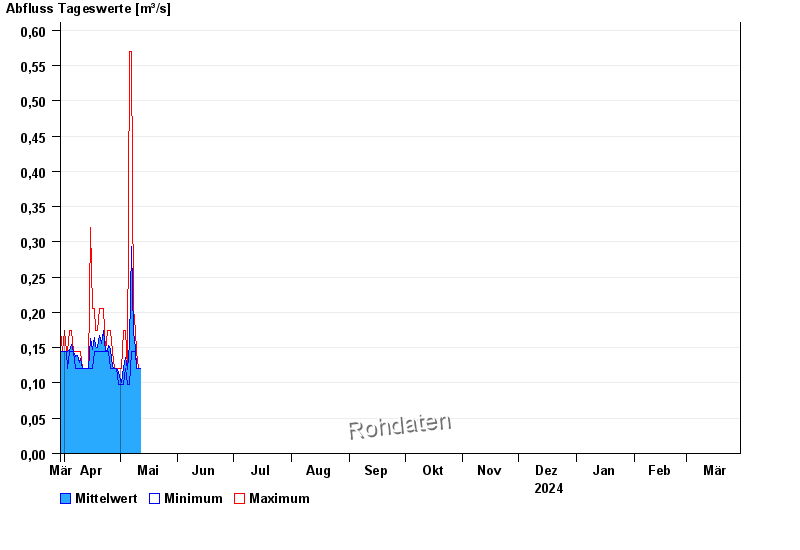
- Chart of year

Chart of year Eggenfelden / Mertseebach
Discharge from 30.03.2024 to 29.03.2025
- 02.03.1987 Abfluss: 13,3 m³/s
- 13.01.2011 Abfluss: 12,8 m³/s
- 02.06.2013 Abfluss: 11,5 m³/s
- 02.08.1991 Abfluss: 11,2 m³/s
- 17.07.2010 Abfluss: 9,99 m³/s
| Date | Mean value [m³/s] | Maximum [m³/s] | Minimum [m³/s] |
|---|---|---|---|
| 27.04.2024 | 0.123 | 0.145 | 0.12 |
| 26.04.2024 | 0.148 | 0.174 | 0.12 |
| 25.04.2024 | 0.153 | 0.174 | 0.145 |
| 24.04.2024 | 0.146 | 0.174 | 0.145 |
| 23.04.2024 | 0.145 | 0.145 | 0.145 |
| 22.04.2024 | 0.174 | 0.205 | 0.145 |
| 21.04.2024 | 0.156 | 0.205 | 0.145 |
© Bayerisches Landesamt für Umwelt 2024