
- Start >
- Rivers >
- Discharge >
- Inn >
- Burghausen >
- Chart of year

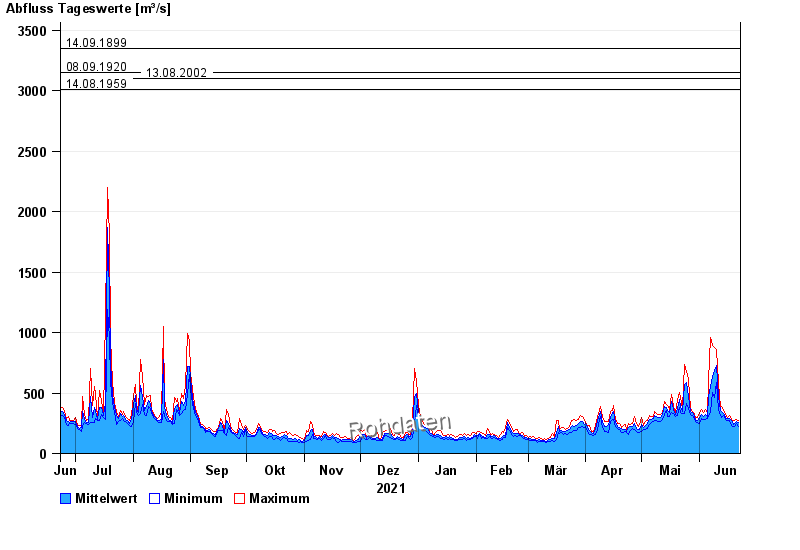
Chart of year Burghausen / Salzach
Discharge from 23.06.2021 to 22.06.2022
- 03.06.2013 Abfluss: 4000 m³/s
- 14.09.1899 Abfluss: 3350 m³/s
- 08.09.1920 Abfluss: 3150 m³/s
- 13.08.2002 Abfluss: 3100 m³/s
- 14.08.1959 Abfluss: 3010 m³/s
| Date | Mean value [m³/s] | Maximum [m³/s] | Minimum [m³/s] |
|---|---|---|---|
| 22.06.2022 | 255 | 274 | 225 |
| 21.06.2022 | 261 | 281 | 244 |
| 20.06.2022 | 251 | 276 | 221 |
| 19.06.2022 | 240 | 270 | 221 |
| 18.06.2022 | 269 | 281 | 231 |
| 17.06.2022 | 290 | 311 | 274 |
| 16.06.2022 | 292 | 299 | 272 |
© Bayerisches Landesamt für Umwelt 2024