
- Start >
- Rivers >
- Discharge >
- Inn >
- Burghausen >
- Chart of year

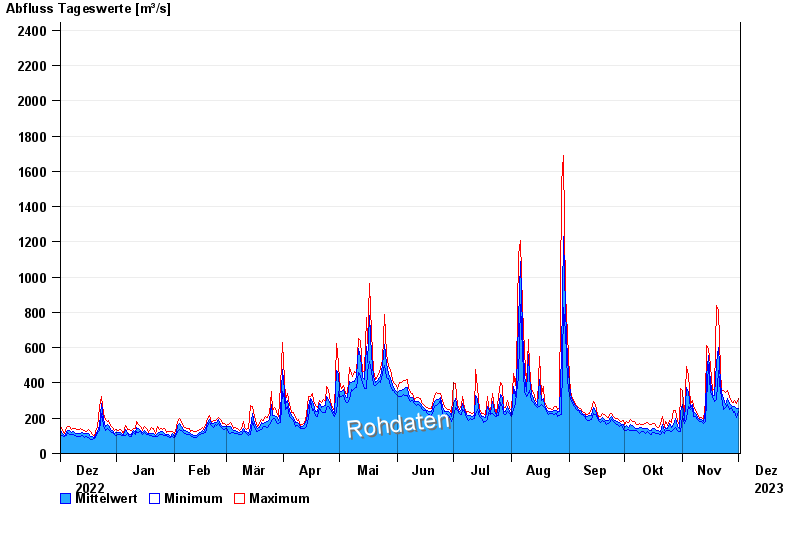
Chart of year Burghausen / Salzach
Discharge from 02.12.2022 to 01.12.2023
- 03.06.2013 Abfluss: 4000 m³/s
- 14.09.1899 Abfluss: 3350 m³/s
- 08.09.1920 Abfluss: 3150 m³/s
- 13.08.2002 Abfluss: 3100 m³/s
- 14.08.1959 Abfluss: 3010 m³/s
| Date | Mean value [m³/s] | Maximum [m³/s] | Minimum [m³/s] |
|---|---|---|---|
| 01.12.2023 | 257 | 311 | 239 |
| 30.11.2023 | 256 | 281 | 204 |
| 29.11.2023 | 269 | 298 | 239 |
| 28.11.2023 | 266 | 290 | 235 |
| 27.11.2023 | 274 | 295 | 258 |
| 26.11.2023 | 281 | 323 | 251 |
| 25.11.2023 | 312 | 355 | 277 |
© Bayerisches Landesamt für Umwelt 2024