
- Start >
- Rivers >
- Discharge >
- Inn >
- Burghausen >
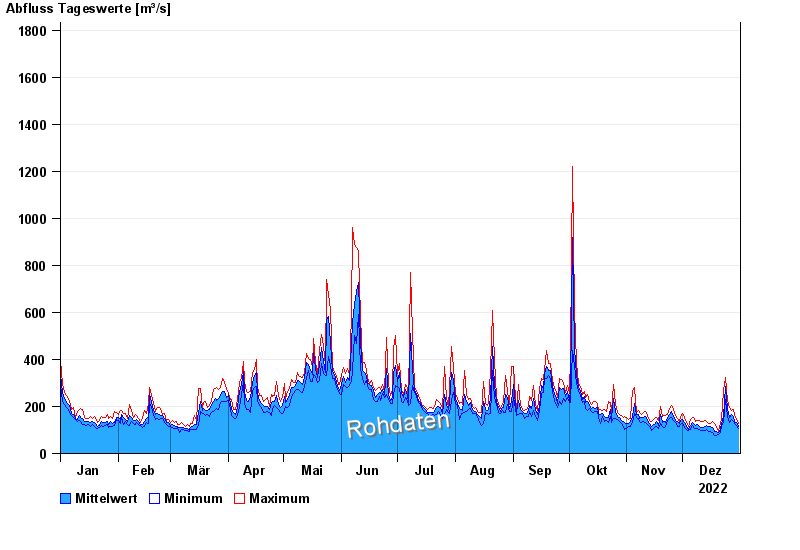
- Chart of year

Chart of year Burghausen / Salzach
Discharge from 01.01.2022 to 31.12.2022
- 03.06.2013 Abfluss: 4000 m³/s
- 14.09.1899 Abfluss: 3350 m³/s
- 08.09.1920 Abfluss: 3150 m³/s
- 13.08.2002 Abfluss: 3100 m³/s
- 14.08.1959 Abfluss: 3010 m³/s
| Date | Mean value [m³/s] | Maximum [m³/s] | Minimum [m³/s] |
|---|---|---|---|
| 31.12.2022 | 114 | 129 | 106 |
| 30.12.2022 | 130 | 148 | 117 |
| 29.12.2022 | 138 | 161 | 127 |
| 28.12.2022 | 157 | 185 | 134 |
| 27.12.2022 | 165 | 183 | 144 |
| 26.12.2022 | 154 | 195 | 132 |
| 25.12.2022 | 192 | 226 | 158 |
© Bayerisches Landesamt für Umwelt 2024