
- Start >
- Rivers >
- Discharge >
- Inn >
- Burghausen >
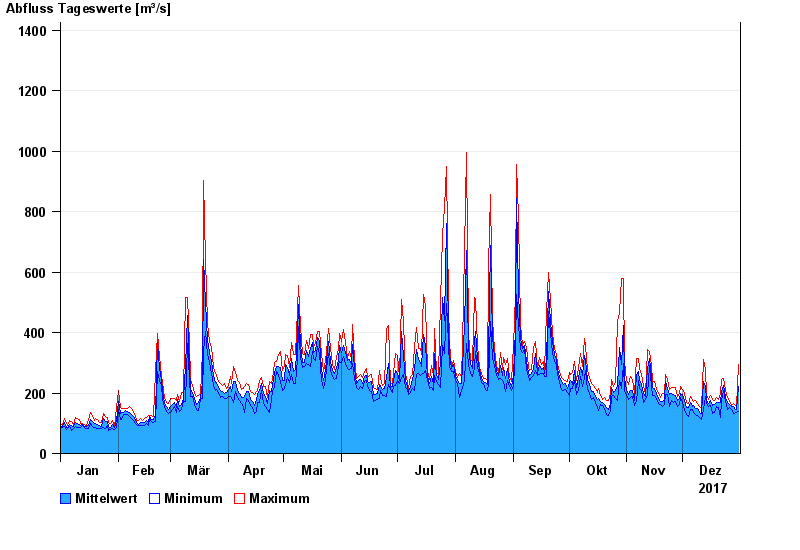
- Chart of year

Chart of year Burghausen / Salzach
Discharge from 01.01.2017 to 31.12.2017
- 03.06.2013 Abfluss: 4000 m³/s
- 14.09.1899 Abfluss: 3350 m³/s
- 08.09.1920 Abfluss: 3150 m³/s
- 13.08.2002 Abfluss: 3100 m³/s
- 14.08.1959 Abfluss: 3010 m³/s
| Date | Mean value [m³/s] | Maximum [m³/s] | Minimum [m³/s] |
|---|---|---|---|
| 31.12.2017 | 221 | 295 | 138 |
| 30.12.2017 | 146 | 155 | 135 |
| 29.12.2017 | 148 | 162 | 132 |
| 28.12.2017 | 156 | 167 | 133 |
| 27.12.2017 | 155 | 160 | 145 |
| 26.12.2017 | 161 | 174 | 153 |
| 25.12.2017 | 168 | 185 | 145 |
© Bayerisches Landesamt für Umwelt 2024