
- Start >
- Rivers >
- Discharge >
- Inn >
- Burghausen >
- Chart of year

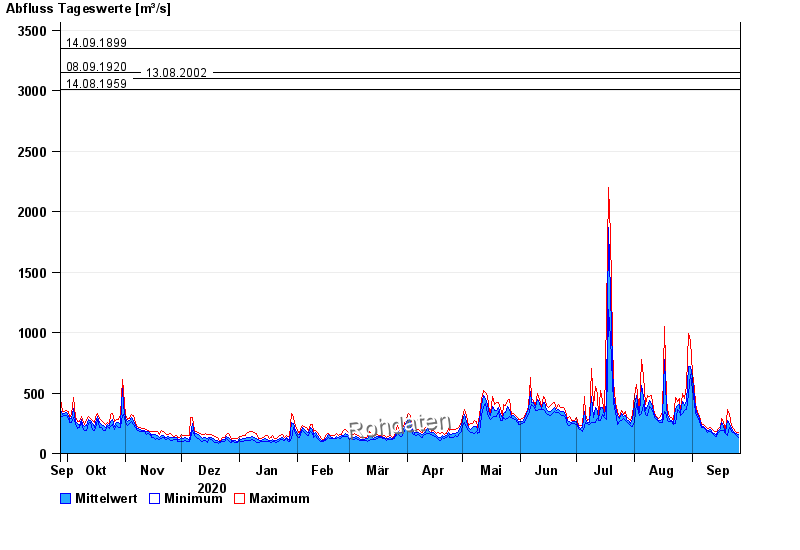
Chart of year Burghausen / Salzach
Discharge from 27.09.2020 to 26.09.2021
- 03.06.2013 Abfluss: 4000 m³/s
- 14.09.1899 Abfluss: 3350 m³/s
- 08.09.1920 Abfluss: 3150 m³/s
- 13.08.2002 Abfluss: 3100 m³/s
- 14.08.1959 Abfluss: 3010 m³/s
| Date | Mean value [m³/s] | Maximum [m³/s] | Minimum [m³/s] |
|---|---|---|---|
| 26.09.2021 | 154 | 173 | 135 |
| 25.09.2021 | 162 | 177 | 150 |
| 24.09.2021 | 177 | 190 | 162 |
| 23.09.2021 | 186 | 210 | 171 |
| 22.09.2021 | 205 | 233 | 183 |
| 21.09.2021 | 252 | 323 | 212 |
| 20.09.2021 | 270 | 363 | 152 |
© Bayerisches Landesamt für Umwelt 2024