
- Start >
- Rivers >
- Discharge >
- Inn >
- Burghausen >
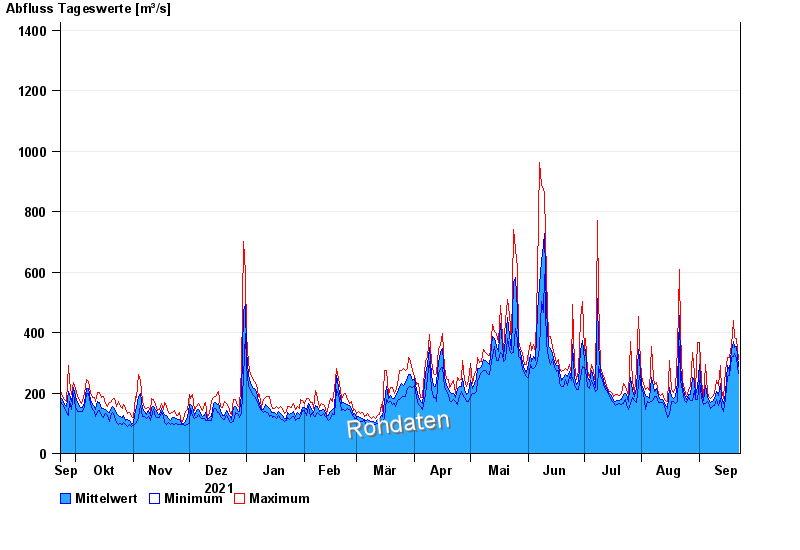
- Chart of year

Chart of year Burghausen / Salzach
Discharge from 23.09.2021 to 22.09.2022
- 03.06.2013 Abfluss: 4000 m³/s
- 14.09.1899 Abfluss: 3350 m³/s
- 08.09.1920 Abfluss: 3150 m³/s
- 13.08.2002 Abfluss: 3100 m³/s
- 14.08.1959 Abfluss: 3010 m³/s
| Date | Mean value [m³/s] | Maximum [m³/s] | Minimum [m³/s] |
|---|---|---|---|
| 22.09.2022 | 287 | 311 | 263 |
| 21.09.2022 | 355 | 381 | 313 |
| 20.09.2022 | 351 | 384 | 330 |
| 19.09.2022 | 370 | 439 | 321 |
| 18.09.2022 | 340 | 358 | 318 |
| 17.09.2022 | 274 | 316 | 258 |
| 16.09.2022 | 290 | 318 | 256 |
© Bayerisches Landesamt für Umwelt 2024