
- Start >
- Rivers >
- Discharge >
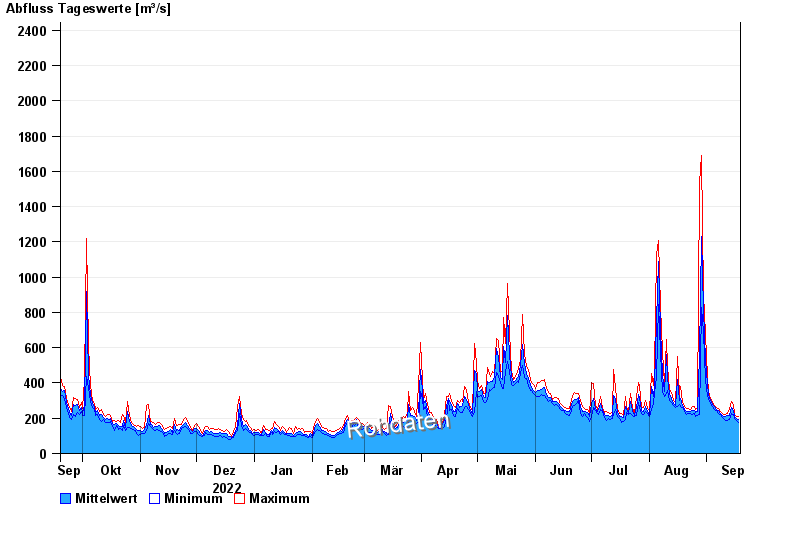
- Inn >
- Burghausen >
- Chart of year

Chart of year Burghausen / Salzach
Discharge from 19.09.2022 to 18.09.2023
- 03.06.2013 Abfluss: 4000 m³/s
- 14.09.1899 Abfluss: 3350 m³/s
- 08.09.1920 Abfluss: 3150 m³/s
- 13.08.2002 Abfluss: 3100 m³/s
- 14.08.1959 Abfluss: 3010 m³/s
| Date | Mean value [m³/s] | Maximum [m³/s] | Minimum [m³/s] |
|---|---|---|---|
| 18.09.2023 | 193 | 209 | 176 |
| 17.09.2023 | 197 | 211 | 185 |
| 16.09.2023 | 207 | 219 | 198 |
| 15.09.2023 | 244 | 277 | 221 |
| 14.09.2023 | 262 | 295 | 229 |
| 13.09.2023 | 216 | 247 | 192 |
| 12.09.2023 | 213 | 229 | 189 |
© Bayerisches Landesamt für Umwelt 2024