
- Start >
- Rivers >
- Discharge >
- Inn >
- Burghausen >
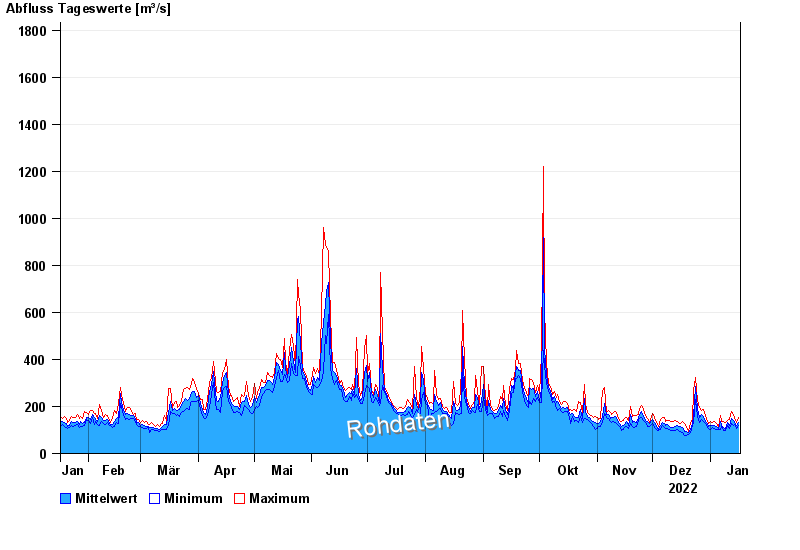
- Chart of year

Chart of year Burghausen / Salzach
Discharge from 17.01.2022 to 16.01.2023
- 03.06.2013 Abfluss: 4000 m³/s
- 14.09.1899 Abfluss: 3350 m³/s
- 08.09.1920 Abfluss: 3150 m³/s
- 13.08.2002 Abfluss: 3100 m³/s
- 14.08.1959 Abfluss: 3010 m³/s
| Date | Mean value [m³/s] | Maximum [m³/s] | Minimum [m³/s] |
|---|---|---|---|
| 16.01.2023 | 130 | 153 | 120 |
| 15.01.2023 | 117 | 132 | 107 |
| 14.01.2023 | 131 | 154 | 123 |
| 13.01.2023 | 140 | 163 | 120 |
| 12.01.2023 | 150 | 179 | 126 |
| 11.01.2023 | 120 | 144 | 106 |
| 10.01.2023 | 130 | 141 | 118 |
© Bayerisches Landesamt für Umwelt 2024