
- Start >
- Rivers >
- Discharge >
- Inn >
- Berchtesgaden-Klärwerk >
- Chart of year

Chart of year Berchtesgaden-Klärwerk / Berchtesgadener Ache
Discharge from 01.01.2018 to 31.12.2018
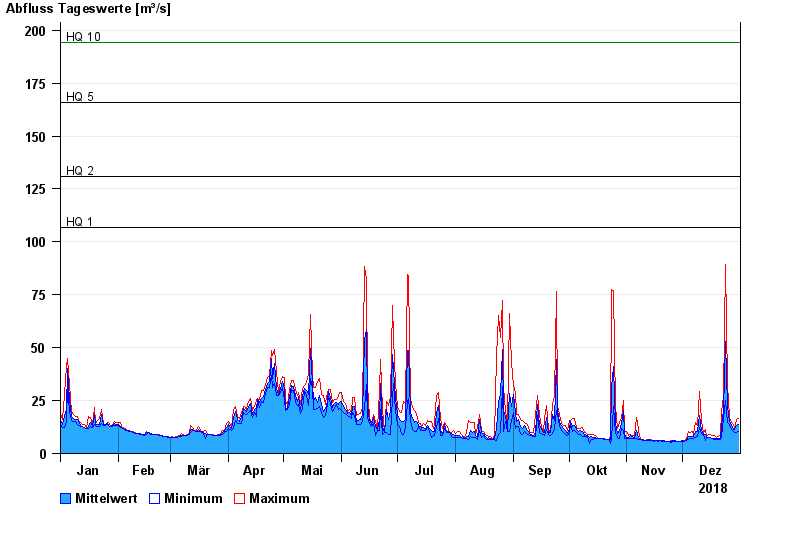
- HQ1 107 m³/s
- HQ2 131 m³/s
- HQ5 166 m³/s
- HQ10 194 m³/s
- HQ20 223 m³/s
- HQ50 267 m³/s
- HQ100 300 m³/s
| Date | Mean value [m³/s] | Maximum [m³/s] | Minimum [m³/s] |
|---|---|---|---|
| 31.12.2018 | 13.6 | 16.6 | 10.5 |
| 30.12.2018 | 13.2 | 16.1 | 9.78 |
| 29.12.2018 | 11.3 | 11.6 | 10.1 |
| 28.12.2018 | 11.5 | 13.9 | 10.5 |
| 27.12.2018 | 13.1 | 14.8 | 11.2 |
| 26.12.2018 | 14.9 | 17 | 13.5 |
| 25.12.2018 | 22 | 32.4 | 14.8 |
© Bayerisches Landesamt für Umwelt 2024