
- Start >
- Rivers >
- Discharge >
- Inn >
- Berchtesgaden-Klärwerk >
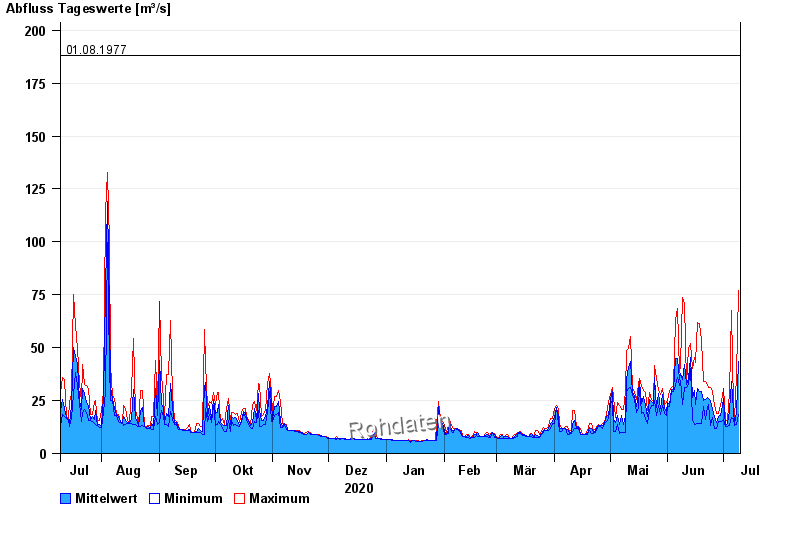
- Chart of year

Chart of year Berchtesgaden-Klärwerk / Berchtesgadener Ache
Discharge from 10.07.2020 to 09.07.2021
- 02.06.2013 Abfluss: 231 m³/s
- 12.08.2002 Abfluss: 223 m³/s
- 26.06.1995 Abfluss: 213 m³/s
- 11.07.2005 Abfluss: 201 m³/s
- 01.08.1977 Abfluss: 188 m³/s
| Date | Mean value [m³/s] | Maximum [m³/s] | Minimum [m³/s] |
|---|---|---|---|
| 09.07.2021 | 43.6 | 76.8 | 18.6 |
| 08.07.2021 | 19.4 | 36.7 | 13.6 |
| 07.07.2021 | 14.2 | 16.6 | 13.1 |
| 06.07.2021 | 20.3 | 21.6 | 16.6 |
| 05.07.2021 | 34 | 67.4 | 17.2 |
| 04.07.2021 | 20.3 | 28.7 | 13.1 |
| 03.07.2021 | 14.3 | 15.7 | 12.8 |
© Bayerisches Landesamt für Umwelt 2024