
- Start >
- Rivers >
- Discharge >
- Inn >
- Berchtesgaden-Klärwerk >
- Chart of year

Chart of year Berchtesgaden-Klärwerk / Berchtesgadener Ache
Discharge from 29.03.2024 to 28.03.2025
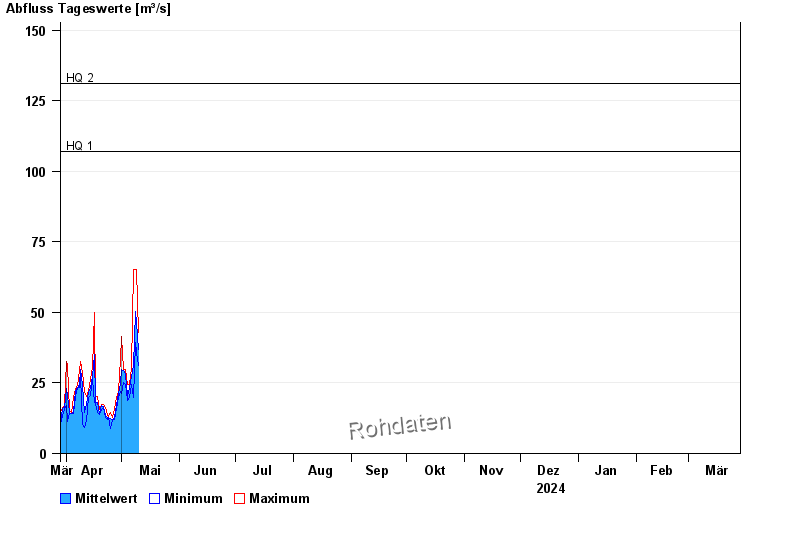
- HQ1 107 m³/s
- HQ2 131 m³/s
- HQ5 166 m³/s
- HQ10 194 m³/s
- HQ20 223 m³/s
- HQ50 267 m³/s
- HQ100 300 m³/s
| Date | Mean value [m³/s] | Maximum [m³/s] | Minimum [m³/s] |
|---|---|---|---|
| 03.06.2024 | 35.6 | 35.9 | 35.2 |
| 02.06.2024 | 41 | 48.2 | 35.9 |
| 01.06.2024 | 45.8 | 49.8 | 38.6 |
| 31.05.2024 | 49.2 | 70.3 | 34.5 |
| 30.05.2024 | 36 | 58.8 | 23.6 |
| 29.05.2024 | 26.4 | 33.2 | 22.5 |
| 28.05.2024 | 34.3 | 58 | 21.9 |
© Bayerisches Landesamt für Umwelt 2024