
- Start >
- Rivers >
- Discharge >
- Inn >
- Berchtesgaden-Klärwerk >
- Chart of year

Chart of year Berchtesgaden-Klärwerk / Berchtesgadener Ache
Discharge from 12.07.2020 to 11.07.2021
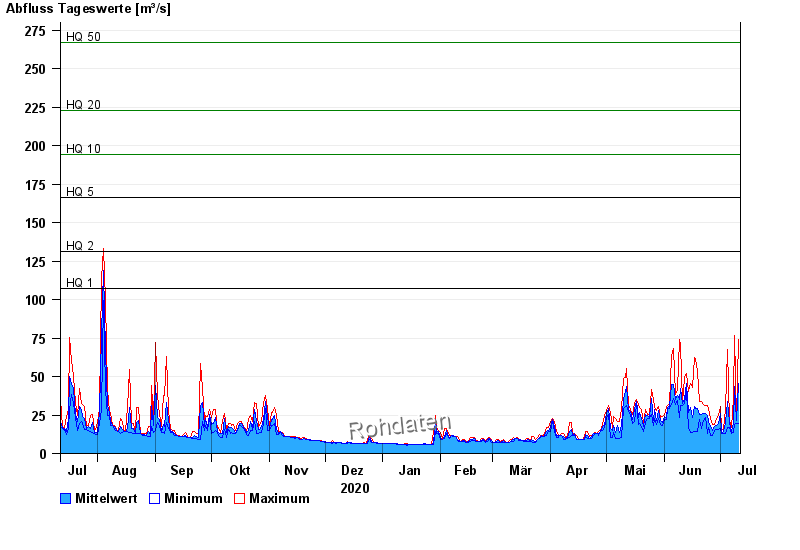
- HQ1 107 m³/s
- HQ2 131 m³/s
- HQ5 166 m³/s
- HQ10 194 m³/s
- HQ20 223 m³/s
- HQ50 267 m³/s
- HQ100 300 m³/s
| Date | Mean value [m³/s] | Maximum [m³/s] | Minimum [m³/s] |
|---|---|---|---|
| 11.07.2021 | 45.4 | 73.9 | 19.6 |
| 10.07.2021 | 21.5 | 22.8 | 19.6 |
| 09.07.2021 | 43.6 | 76.8 | 18.6 |
| 08.07.2021 | 19.4 | 36.7 | 13.6 |
| 07.07.2021 | 14.2 | 16.6 | 13.1 |
| 06.07.2021 | 20.3 | 21.6 | 16.6 |
| 05.07.2021 | 34 | 67.4 | 17.2 |
© Bayerisches Landesamt für Umwelt 2024