
- Start >
- Rivers >
- Discharge >
- Inn >
- Berchtesgaden-Klärwerk >
- Chart of year

Chart of year Berchtesgaden-Klärwerk / Berchtesgadener Ache
Discharge from 04.08.2020 to 03.08.2021
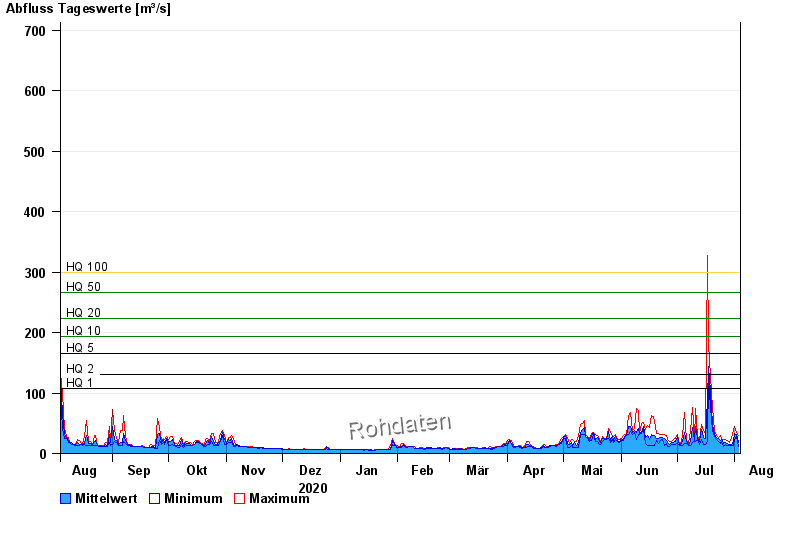
- HQ1 107 m³/s
- HQ2 131 m³/s
- HQ5 166 m³/s
- HQ10 194 m³/s
- HQ20 223 m³/s
- HQ50 267 m³/s
- HQ100 300 m³/s
| Date | Mean value [m³/s] | Maximum [m³/s] | Minimum [m³/s] |
|---|---|---|---|
| 03.08.2021 | 18.3 | 29.3 | 10.9 |
| 02.08.2021 | 31.9 | 35.2 | 28 |
| 01.08.2021 | 33.5 | 44.6 | 23.9 |
| 31.07.2021 | 20 | 37.3 | 13.2 |
| 30.07.2021 | 15.7 | 24.5 | 13.2 |
| 29.07.2021 | 14.1 | 17.6 | 13.2 |
| 28.07.2021 | 16.2 | 21.6 | 13.6 |
© Bayerisches Landesamt für Umwelt 2024