
- Start >
- Rivers >
- Discharge >
- Inn >
- Bad Wiessee >
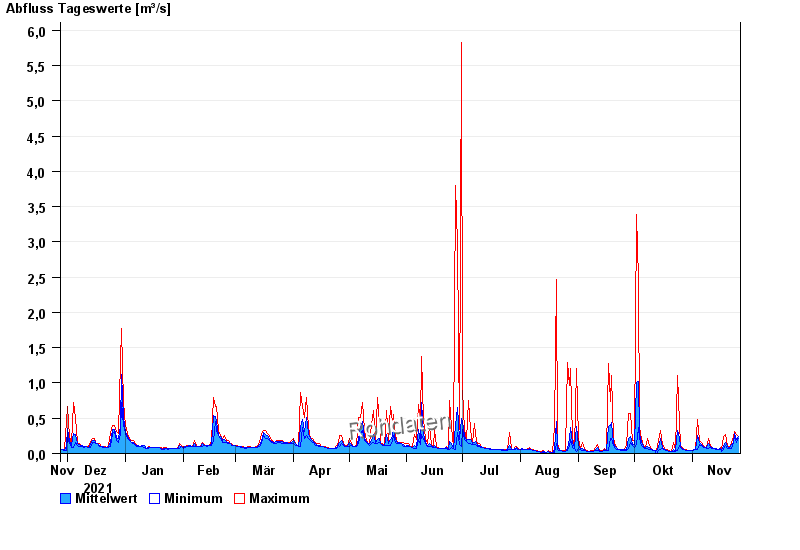
- Chart of year

Chart of year Bad Wiessee / Zeiselbach
Discharge from 27.11.2021 to 26.11.2022
| Date | Mean value [m³/s] | Maximum [m³/s] | Minimum [m³/s] |
|---|---|---|---|
| 26.11.2022 | 0.238 | 0.239 | 0.206 |
| 25.11.2022 | 0.201 | 0.273 | 0.153 |
| 24.11.2022 | 0.288 | 0.31 | 0.239 |
| 23.11.2022 | 0.156 | 0.239 | 0.153 |
| 22.11.2022 | 0.126 | 0.153 | 0.077 |
| 21.11.2022 | 0.087 | 0.092 | 0.077 |
| 20.11.2022 | 0.095 | 0.11 | 0.077 |
© Bayerisches Landesamt für Umwelt 2024