
- Start >
- Rivers >
- Discharge >
- Inn >
- Bad Wiessee >
- Chart of year

Chart of year Bad Wiessee / Zeiselbach
Discharge from 01.01.2020 to 31.12.2020
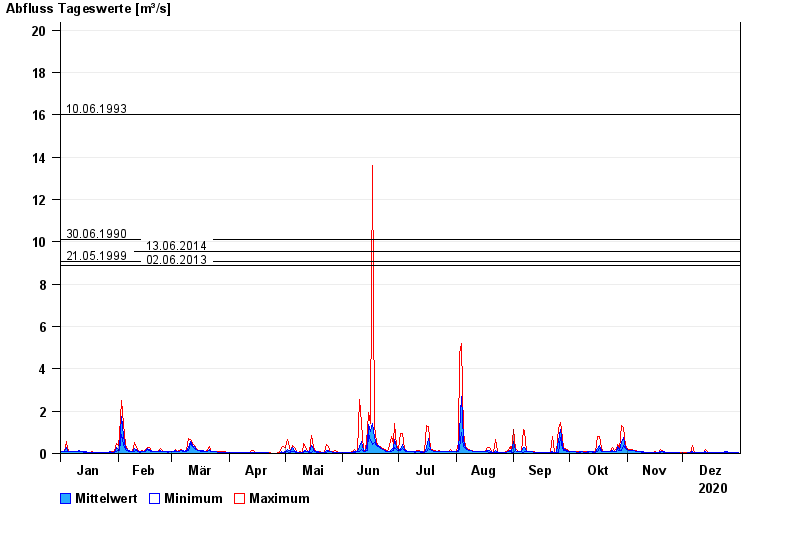
- 10.06.1993 Abfluss: 16 m³/s
- 30.06.1990 Abfluss: 10,1 m³/s
- 13.06.2014 Abfluss: 9,54 m³/s
- 21.05.1999 Abfluss: 9,06 m³/s
- 02.06.2013 Abfluss: 8,89 m³/s
| Date | Mean value [m³/s] | Maximum [m³/s] | Minimum [m³/s] |
|---|---|---|---|
| 31.12.2020 | 0.032 | 0.039 | 0.022 |
| 30.12.2020 | 0.042 | 0.05 | 0.03 |
| 29.12.2020 | 0.046 | 0.05 | 0.03 |
| 28.12.2020 | 0.05 | 0.05 | 0.039 |
| 27.12.2020 | 0.036 | 0.051 | 0.03 |
| 26.12.2020 | 0.056 | 0.064 | 0.022 |
| 25.12.2020 | 0.076 | 0.079 | 0.064 |
© Bayerisches Landesamt für Umwelt 2024