
- Start >
- Rivers >
- Discharge >
- Inn >
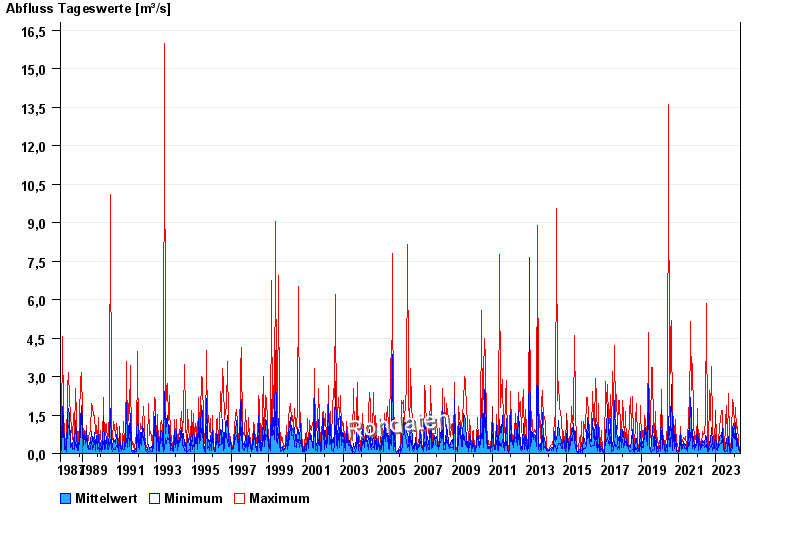
- Bad Wiessee >
- Chart of total period

Chart of total period Bad Wiessee / Zeiselbach
Discharge from 01.11.1987 to 26.04.2024
| Date | Mean value [m³/s] | Maximum [m³/s] | Minimum [m³/s] |
|---|---|---|---|
| 26.04.2024 | 0.127 | 0.21 | 0.113 |
| 25.04.2024 | 0.116 | 0.133 | 0.113 |
| 24.04.2024 | 0.118 | 0.133 | 0.113 |
| 23.04.2024 | 0.119 | 0.133 | 0.113 |
| 22.04.2024 | 0.139 | 0.156 | 0.133 |
| 21.04.2024 | 0.155 | 0.156 | 0.133 |
| 20.04.2024 | 0.194 | 0.277 | 0.156 |
© Bayerisches Landesamt für Umwelt 2024