

Chart of year Bad Tölz / Ellbach
Discharge from 29.03.2024 to 28.03.2025
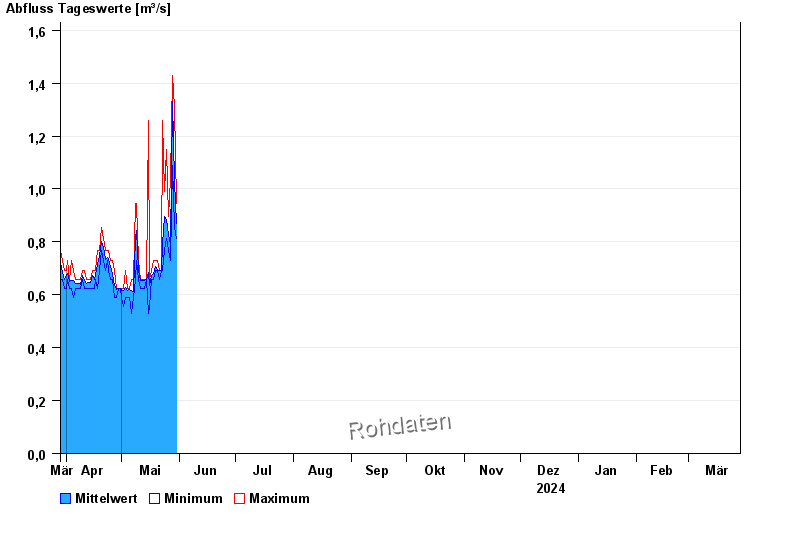
| Date | Mean value [m³/s] | Maximum [m³/s] | Minimum [m³/s] |
|---|---|---|---|
| 08.05.2024 | 0.79 | 0.945 | 0.657 |
| 07.05.2024 | 0.613 | 0.657 | 0.589 |
| 06.05.2024 | 0.616 | 0.657 | 0.528 |
| 05.05.2024 | 0.619 | 0.622 | 0.589 |
| 04.05.2024 | 0.618 | 0.622 | 0.589 |
| 03.05.2024 | 0.629 | 0.693 | 0.589 |
| 02.05.2024 | 0.618 | 0.622 | 0.557 |
© Bayerisches Landesamt für Umwelt 2024