

Chart of year Bad Tölz / Ellbach
Discharge from 22.10.2021 to 21.10.2022
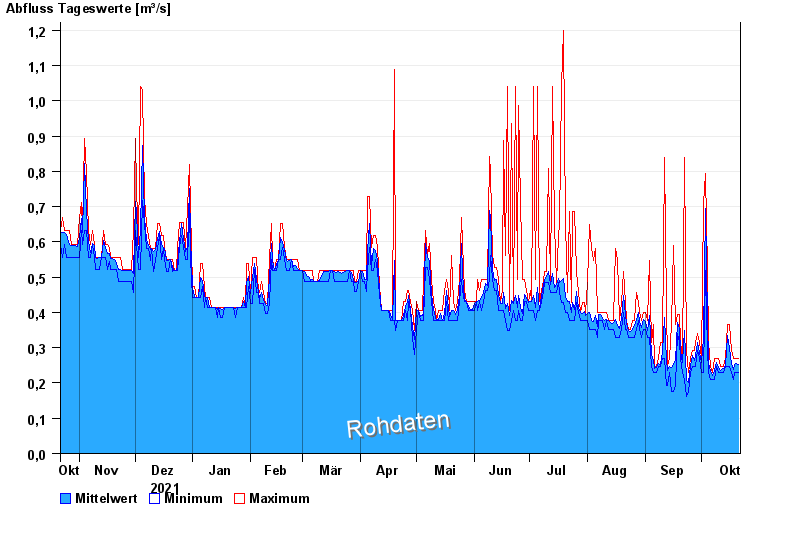
| Date | Mean value [m³/s] | Maximum [m³/s] | Minimum [m³/s] |
|---|---|---|---|
| 21.10.2022 | 0.253 | 0.269 | 0.229 |
| 20.10.2022 | 0.255 | 0.269 | 0.229 |
| 19.10.2022 | 0.252 | 0.269 | 0.229 |
| 18.10.2022 | 0.238 | 0.269 | 0.21 |
| 17.10.2022 | 0.255 | 0.291 | 0.229 |
| 16.10.2022 | 0.299 | 0.366 | 0.248 |
| 15.10.2022 | 0.334 | 0.366 | 0.248 |
© Bayerisches Landesamt für Umwelt 2024