
- Start >
- Rivers >
- Discharge >
- Inn >
- Bad Kreuth >
- Chart of year

Chart of year Bad Kreuth / Sagenbach
Discharge from 29.03.2024 to 28.03.2025
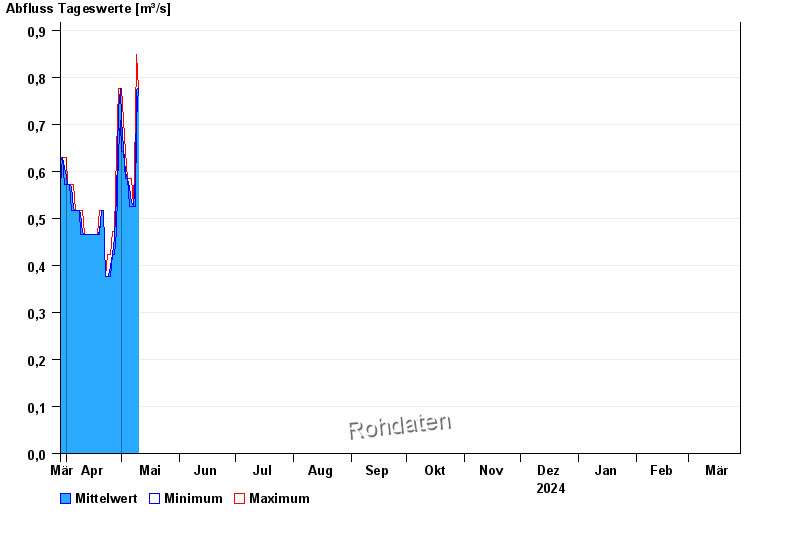
| Date | Mean value [m³/s] | Maximum [m³/s] | Minimum [m³/s] |
|---|---|---|---|
| 27.04.2024 | 0.611 | 0.688 | 0.572 |
| 26.04.2024 | 0.573 | 0.629 | 0.572 |
| 25.04.2024 | 0.541 | 0.572 | 0.517 |
| 24.04.2024 | 0.519 | 0.572 | 0.517 |
| 23.04.2024 | 0.518 | 0.572 | 0.517 |
| 22.04.2024 | 0.517 | 0.517 | 0.517 |
| 21.04.2024 | 0.517 | 0.517 | 0.517 |
© Bayerisches Landesamt für Umwelt 2024