
- Start >
- Rivers >
- Discharge >
- Inn >
- Bad Kreuth >
- Chart of year

Chart of year Bad Kreuth / Sagenbach
Discharge from 01.01.2023 to 31.12.2023
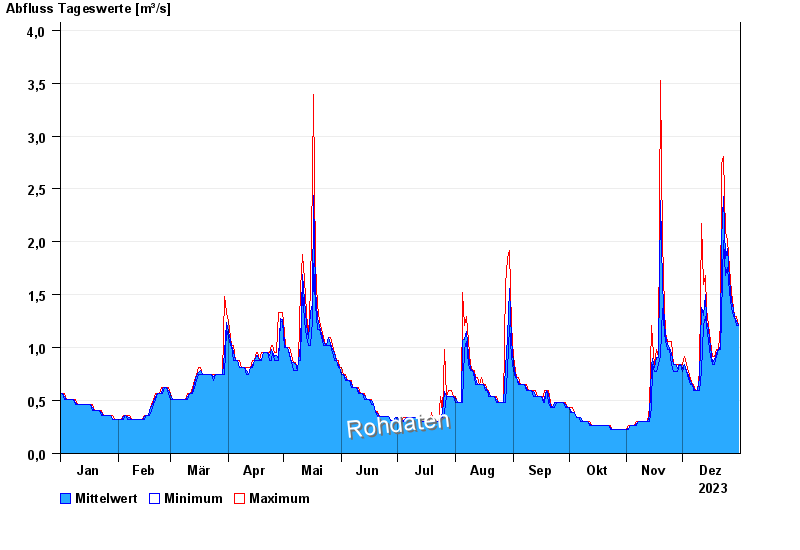
| Date | Mean value [m³/s] | Maximum [m³/s] | Minimum [m³/s] |
|---|---|---|---|
| 31.12.2023 | 1.21 | 1.21 | 1.21 |
| 30.12.2023 | 1.25 | 1.29 | 1.21 |
| 29.12.2023 | 1.29 | 1.29 | 1.29 |
| 28.12.2023 | 1.36 | 1.37 | 1.29 |
| 27.12.2023 | 1.44 | 1.52 | 1.37 |
| 26.12.2023 | 1.64 | 1.76 | 1.52 |
| 25.12.2023 | 1.94 | 2.01 | 1.76 |
© Bayerisches Landesamt für Umwelt 2024