
- Start >
- Rivers >
- Discharge >
- Inn >
- Bad Aibling Q >
- Chart of year

Chart of year Bad Aibling Q / Triftbach
Discharge from 10.02.2023 to 09.02.2024
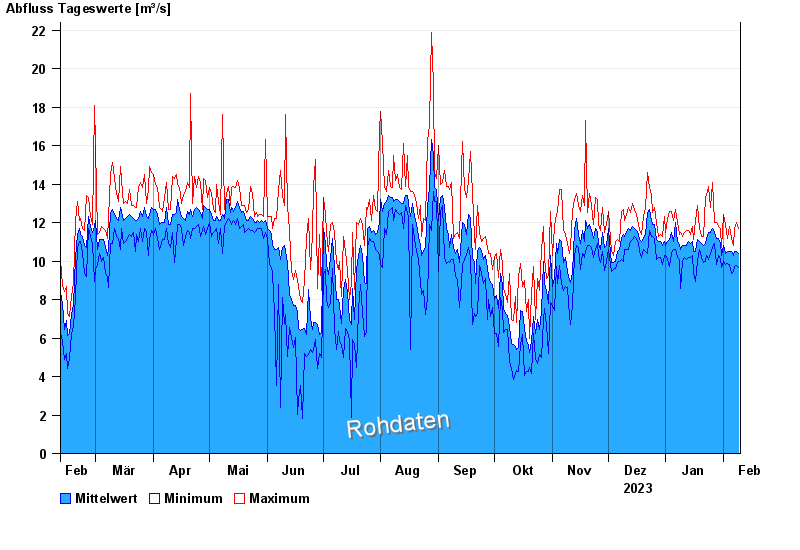
note
Schneefall kann die Messdaten verfälschen.
| Date | Mean value [m³/s] | Maximum [m³/s] | Minimum [m³/s] |
|---|---|---|---|
| 09.02.2024 | 10.4 | 11.7 | 9.66 |
| 08.02.2024 | 10.5 | 12 | 9.75 |
| 07.02.2024 | 10.5 | 11.7 | 9.73 |
| 06.02.2024 | 10.3 | 10.8 | 9.45 |
| 05.02.2024 | 10.5 | 11.2 | 9.37 |
| 04.02.2024 | 10.5 | 11.8 | 9.84 |
| 03.02.2024 | 10.5 | 11.2 | 9.87 |
© Bayerisches Landesamt für Umwelt 2024