

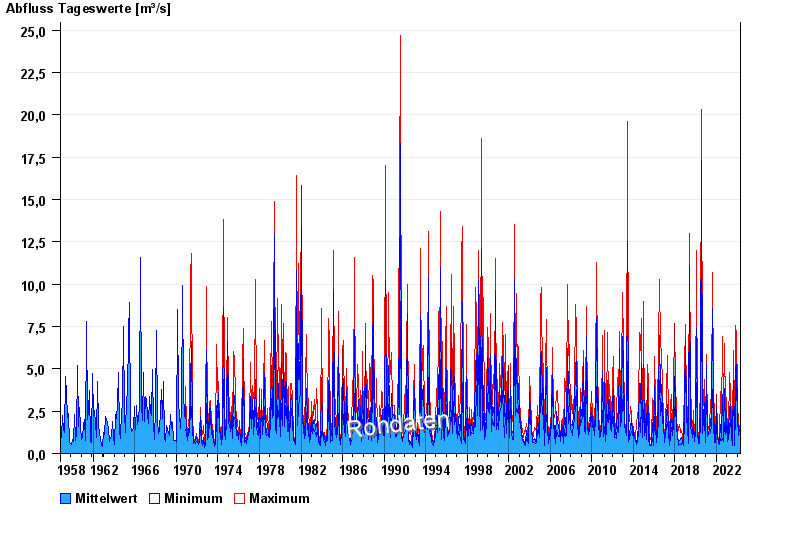
Chart of total period Aßling / Attel
Discharge from 01.11.1958 to 02.05.2024
| Date | Mean value [m³/s] | Maximum [m³/s] | Minimum [m³/s] |
|---|---|---|---|
| 02.05.2024 | 0.626 | 0.628 | 0.577 |
| 01.05.2024 | 0.637 | 0.68 | 0.628 |
| 30.04.2024 | 0.64 | 0.68 | 0.628 |
| 29.04.2024 | 0.647 | 0.68 | 0.577 |
| 28.04.2024 | 0.647 | 0.68 | 0.628 |
| 27.04.2024 | 0.695 | 0.734 | 0.68 |
| 26.04.2024 | 0.768 | 0.789 | 0.734 |
© Bayerisches Landesamt für Umwelt 2024