

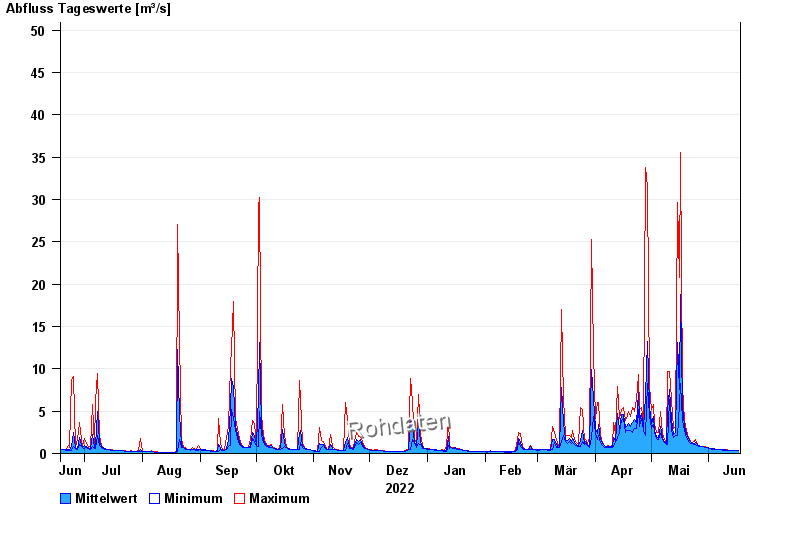
Chart of year Aschau / Prien
Discharge from 18.06.2022 to 17.06.2023
- 01.06.2013 Abfluss: 128 m³/s
- 12.08.2002 Abfluss: 110 m³/s
- 03.06.2010 Abfluss: 98,3 m³/s
- 04.08.2020 Abfluss: 80,3 m³/s
- 05.01.2013 Abfluss: 78,6 m³/s
| Date | Mean value [m³/s] | Maximum [m³/s] | Minimum [m³/s] |
|---|---|---|---|
| 17.06.2023 | 0.345 | 0.345 | 0.345 |
| 16.06.2023 | 0.345 | 0.345 | 0.345 |
| 15.06.2023 | 0.345 | 0.345 | 0.345 |
| 14.06.2023 | 0.38 | 0.4 | 0.345 |
| 13.06.2023 | 0.4 | 0.4 | 0.4 |
| 12.06.2023 | 0.4 | 0.4 | 0.4 |
| 11.06.2023 | 0.401 | 0.462 | 0.4 |
© Bayerisches Landesamt für Umwelt 2024