

Chart of year Aschau / Prien
Discharge from 27.05.2020 to 26.05.2021
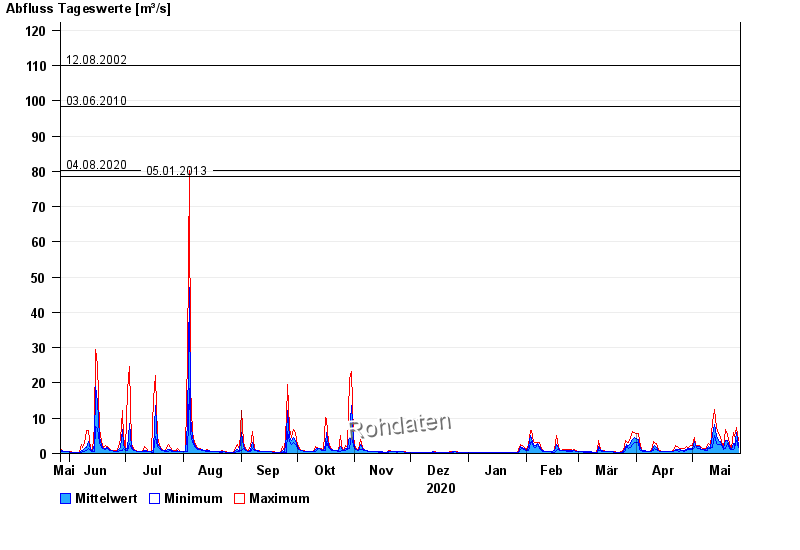
- 01.06.2013 Abfluss: 128 m³/s
- 12.08.2002 Abfluss: 110 m³/s
- 03.06.2010 Abfluss: 98,3 m³/s
- 04.08.2020 Abfluss: 80,3 m³/s
- 05.01.2013 Abfluss: 78,6 m³/s
| Date | Mean value [m³/s] | Maximum [m³/s] | Minimum [m³/s] |
|---|---|---|---|
| 26.05.2021 | 2.26 | 3.58 | 1.61 |
| 25.05.2021 | 5.88 | 7.51 | 3.58 |
| 24.05.2021 | 1.91 | 4.85 | 1.31 |
| 23.05.2021 | 2.93 | 5.97 | 1.04 |
| 22.05.2021 | 1.19 | 1.45 | 1.04 |
| 21.05.2021 | 1.86 | 2.71 | 1.45 |
| 20.05.2021 | 3.82 | 5.4 | 2.71 |
© Bayerisches Landesamt für Umwelt 2024