

Chart of year Aschau / Prien
Discharge from 09.04.2020 to 08.04.2021
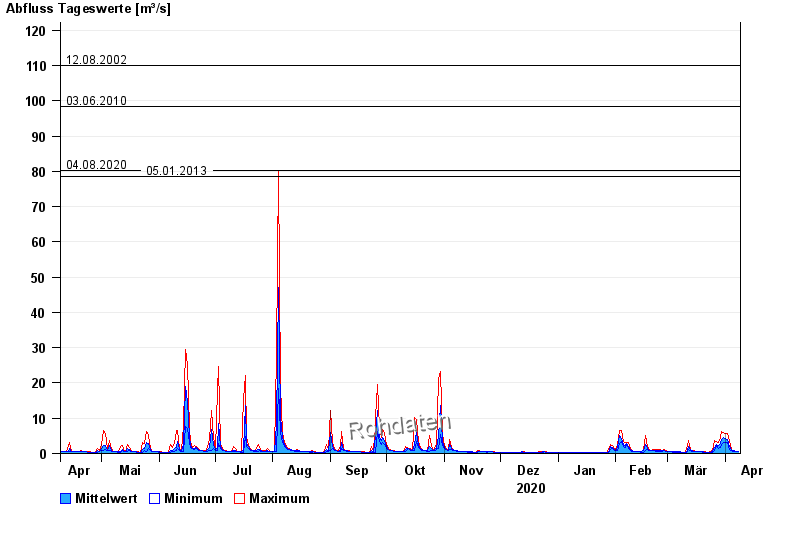
- 01.06.2013 Abfluss: 128 m³/s
- 12.08.2002 Abfluss: 110 m³/s
- 03.06.2010 Abfluss: 98,3 m³/s
- 04.08.2020 Abfluss: 80,3 m³/s
- 05.01.2013 Abfluss: 78,6 m³/s
| Date | Mean value [m³/s] | Maximum [m³/s] | Minimum [m³/s] |
|---|---|---|---|
| 08.04.2021 | 0.571 | 0.611 | 0.542 |
| 07.04.2021 | 0.639 | 0.689 | 0.611 |
| 06.04.2021 | 0.732 | 0.873 | 0.689 |
| 05.04.2021 | 0.751 | 0.873 | 0.689 |
| 04.04.2021 | 0.964 | 1.21 | 0.777 |
| 03.04.2021 | 2.05 | 3.36 | 1.21 |
| 02.04.2021 | 4.07 | 5.65 | 3.14 |
© Bayerisches Landesamt für Umwelt 2024